

sided long-axis with left atrium and left ventricle, and the left-sided long-axis with left ventricular outflow tract (21). This is sometimes the only way to measure some of the equine parameters, especially the left atrium.
Measurement and Assessment of M-Mode Images
Measurement Guidelines for M-Mode Images
Recommendations for measurement of M-mode images in man are set by the American Society of Echocardiography (ASE) (25,38). The same guidelines are followed for veterinary species. The recommendations are not made because one location for measurement is necessarily any better than another as far as predicting true cardiac size. They were made because they generated the least variability among human echocardiographers. The ASE recommends that all diastolic measurements be made at the onset of the QRS complex. Using the ECG for timing and measurement purposes assures consistency in measuring methods among examiners as well as providing greater accuracy in comparing measurements from serial examinations in the same patient. When an ECG is not recorded on the M-mode image, use the largest ventricular dimension for diastolic measurements. In man, very little difference is found between measurements made at the beginning of the QRS complex and those made at the largest ventricular dimension except in children where there is a greater increase in dimension at the very end of diastole.
The ASE also adheres to a measuring method referred to as the leading edge theory. This means that measurements are made from the leading or top edge of one structure to the leading edge of the next structure. This helps eliminate any variability in boundary thickness created by different ultrasound equipment as well as differences in gain settings, both of which may increase the perceived thickness of structures.
The ASE recommends making measurements at end respiration. At least three to five cardiac cycles should be used and averaged for each measurement. This should negate any effects of respiration and changes in filling secondary to sinus arrhythmias.
M-modes may be obtained and measured from longor short-axis views (20,39). Studies comparing M-mode values to two-dimensional measurements found better correlation between short-axis M- mode and two-dimensional measurements but the M-modes were not obtained with real-time guidance (20). Care to obtain very specific sites and planes when placing the M-mode cursor over cardiac structures on either the longor short-axis views should yield similar values. Normal values have been generated using both methods. The goals when obtaining two-dimensional images for generation of M-mode images are to maximize left ventricular size on long-axis left ventricular outflow views and to minimize it on transverse left ventricular views.
Obtaining M-modes with the animal in standing or lateral recumbency does not affect the reliability and repeatability of most measurements. Coefficients of variability were less than 15% for most variables. Standing position had similar or better coefficients of variability in all but septal thickness measurements. Experience is a factor, and scanning an animal in a consistent position will create repeatable measurements with less variation; however, knowing how to obtain echoes from a standing positions is a good skill to develop if animals are dyspneic or stressed (40). This same study showed that experienced sonographers may generate reliable echocardiographic measurements using only one cardiac cycle.
Anatomic M-mode is the ability of ultrasound technology to create M-modes from saved echocardiographic two-dimensional video loops. The cursor can be manipulated to align across the two-dimensional structures in directions different from the axis of the ultrasound beam. Anatomical M-mode can be superior to conventional M-mode if the two-dimensional image is of high enough quality and if the angle of correction is less than 30° (41).
Some normal M-mode reference values are made within this section of text, but complete reference tables for dogs (42–54), cats (18,19,42,55–64), horses (15–17,65–70), sheep (71), swine (72,73), llamas (74), cows (75–78), and other species are found in the appendices. All parameters of chamber size and wall thickness in the dog have a linear or logarithmic relationship with weight and body surface area. The correlation coefficients for these cardiac dimensions with weight or body surface area are very similar. The difference in actual measurements is minimal with most predictions for normal ranges falling within 2 mm of each other when using either method. In order to make application of the data easier in the adult dog, the appendix includes charts with normal ranges for each parameter at each BSA. Weights corresponding to each BSA are included in the charts. Several breeds have been studied extensively enough to have their own normal reference values. These are available in the appendices.
Breeds with Own Reference Values
Beagle
Pembroke Welsh Corgi
Afghan Hound
Greyhound
Miniature Poodle
English Cocker Spaniel
Golden Retriever
Whippet
Italian Greyhound
English Pointer
Newfoundland
Great Dane
Spanish Mastiff
Boxer
Estrella Mountain Dog
Irish Wolfhound
German Shepherd
Dachshund
Deerhound
Cavalier King Charles Spaniel
Maine Coon Cats
There is a correlation between feline heart dimensions and body size, but the correlation is weak, probably due to the small degree of variation in weight. Values correlating the cardiac parameter to BSA or weight are generally not used, and a single reference range for each variable is used for all cats.
Studies have attempted to correlate cardiac dimensions with weight, body surface area, and height in the horse, but the correlation is weak, and as in cats, a normal range for each parameter is usually used in all horses regardless of size. There are some breed-specific reference ranges included in the appendices.

Cardiac dimensions obviously must increase as an animal grows, and several studies have been performed in foals, puppies, and calves with established growth-related changes in cardiac dimensions and function (15,47,51,65,75–77). Only the left ventricular wall thickness increases with advancing age after the animal reaches maturity. All other parameters appear to remain static during the aging process.
Puppies with Own Reference Values
Bull Mastiffs
Spanish Mastiff
English Pointers
Portuguese Water Dog
Several studies have determined the effects of heart rate and other variables on echocardiographic parameters of size. Inverse relationships exist for heart rate and weight, left ventricular systolic and diastolic dimensions, and left atrial size (18,44,45,59). The effect of heart rate on ventricular dimension is nominal however.
The following sections will emphasize technique for measuring M-mode echocardiograms. Important differences between breeds and species will be pointed out, and factors affecting the measurement will be discussed. Each individual M-mode measurement of size and function is just one piece of the puzzle and should not be used alone when making an echocardiographic interpretation. All the information should be put together and analyzed as a whole. The entire set of data should fit together logically. If some information does not fit the puzzle, technical error maybe a factor, but just as likely another problem is present that has not been identified. Exercises included at the end of this chapter show how to analyze the entire echocardiographic exam.
Left Ventricle
Measurement
Left ventricular M-modes are obtained from two-dimensional images with the cursor placed between the papillary muscles and the tip of the mitral valve leaflets (Figure 4.27). This location is easier to identify on long-axis left ventricular inflow outflow images. Maximize the length and width of the left ventricular chamber when using the long-axis view. When the septum and left ventricular wall are parallel to each other on the long-axis image, the longest, widest left ventricular chamber has been obtained, even if the apex of the heart is not in the sector image. Make sure that the aortic valve is seen and that mitral valve is moving well when using this imaging plane to generate M-modes. The cursor should be perpendicular to the left ventricular wall.
M-mode measurement of the LV
From the Long Axis
Left ventricular inflow outflow view
Maximize length and width of LV
No curve to LV wall
Good MV motion
Aortic valve in middle of aorta
From Short Axis

Level of chordae tendinae
Smallest symmetrical chamber
See a good RV
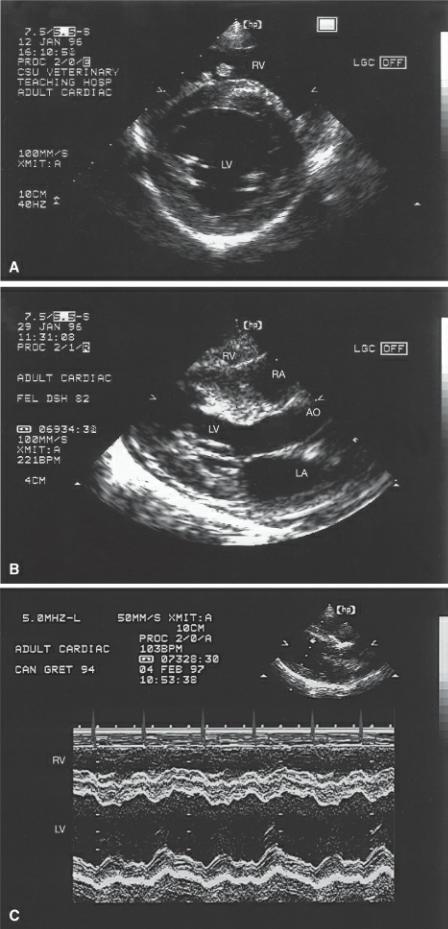
Figure 4.27 Left ventricular M-modes may be obtained from several real-time views. (A) The right parasternal long-axis left ventricular outflow view in the (A) dog and in the (B) horse. (C) Right parasternal transverse images of the left ventricle at the level of the chordae tendinae in large and small animals may also be used. (D) Right parasternal four-chamber views are also used in the horse. The M-mode cursor (arrow) is placed perpendicular to the septum and left ventricular wall. It should be located between the tips of the mitral valve leaflets and the papillary muscles over the chordae tendinae in both long-axis and transverse planes. RV = right ventricle, LV = left ventricle, IVS = interventricular septum, AO = aorta, LA = left atrium, LVW = left ventricular wall.

When a transverse image is used to create LV M-modes, fan the transducer between the level of the papillary muscles and the mitral valve until a good image of the chordae are obtained within a symmetrical circular left ventricular chamber. Obtain the smallest left ventricular chamber at the level of the chordae. This assures that the image is obtained along the true transverse image. If the imaging plane is oblique to the true transverse plane of the left ventricular chamber, the diameter will be larger. The right ventricular chamber should be seen at the top of the sector image with enough space to show a clearly defined top to the interventricular septum. If the right ventricle is not appreciated well, the transducer is probably too close to the apex of the heart. Twist the transducer to the long axis; if the apex is higher on the sector image than the base of the heart, the transducer is too close to the apex and not under the middle of the heart. Slide the transducer cranial and dorsal in order to fix this problem. The M-mode cursor should bisect the left ventricular chamber into equal and symmetrical halves, and be perpendicular to a line that connects the chordae tendinae.
The M-mode image can show some chordae tendinae within the left ventricular chamber (Figures 4.28, 4.29). In small animals like kittens and very young puppies, the distance between the mitral valve and papillary muscles is often much closer and more mitral valve is recorded in M-modes of the

left ventricle. The recommendation by the ASE is to record and measure the left ventricle at the level of the mitral valve tips in young children and infants.
In young children and infants, LV M-modes are obtained at the level of the chordae. This may be necessary in many puppies and kittens although no standards have been set.
Figure 4.28 This is an M-mode of the left ventricle in a horse. The left ventricular M-mode displays the right ventricular wall and right ventricle at the top of the image. The interventricular septum, left ventricular chamber, and left ventricular wall below them. RVW = right ventricular wall, RV = right ventricle, IVS = interventricular septum, LV = left ventricle, LVW = left ventricular wall, CT = chordae tendinae, P = pericardium, d = diastole, s = systole.
Figure 4.29 M-modes in cats require increased sweep speeds in order to spread out the events of diastole and systole. RVW = right ventricular wall, RV = right ventricle, IVS = interventricular septum, LV = left ventricle, LVW = left ventricular wall, CT = chordae tendinae, P = pericardium, d = diastole, s = systole.
When left ventricular images are not oriented on the sector to allow perpendicular placement of the M-mode cursor to the septum and left ventricular free wall, more accurate measurements of size and function will be obtained from the two-dimensional image itself. Use a cine loop if available and advance the loop frame by frame until the largest and smallest left ventricular dimensions are identified for measurements.

While the ASE recommends measuring diastolic chamber dimensions at the beginning of the QRS complex, the recommendation for measurement of systolic chamber size is at the peak downward point of septal motion (Figure 4.30). The free wall should be used when septal motion is abnormal. Measurements should be made straight up or down from whatever point is selected, do not move diagonally across the ventricular chamber from septum to wall. Diastolic and systolic left ventricular chamber measurements are made from the top of the endocardial surface of the left ventricular side of the septum to the top of the left ventricular free wall. Therefore, a small amount of septal thickness is included in left ventricular chamber dimension measurements. Free wall and septal thicknesses are measured along the same lines that chamber dimensions are obtained. The interventricular septum is measured from the top of the septum to the top of the endocardial surface at the bottom of the septum during both systole and diastole. The left ventricular free wall measurement starts at the top of the left ventricular wall and goes down to the top of the bright line defining the pericardial sac.
Figure 4.30 Measurement from left ventricular M-modes includes the following: (1) left ventricular chamber during diastole, (2) left ventricular chamber during systole, (3) interventricular septum during diastole, (4) interventricular septum during systole, (5) left ventricular wall during diastole, (6) left ventricular wall during systole. See the text for details. RVW = right ventricular wall, RV = right ventricle, IVS = interventricular septum, LV = left ventricle, LVW = left ventricular wall, P = pericardium.
Wall and septal excursion measurements are sometimes made from M-mode images. These measure the greatest distance the wall makes upward during systole and the septum makes downward during systole.
Figure 4.31 shows an appropriate M-mode image for measurement. Clear boundaries are present as well as some chordae within the left ventricular chamber.
Figure 4.31 This represents an acceptable left ventricular M-mode image for measuring chamber dimensions. There are some chordae visible within the chamber (arrow). RV = right ventricle, LV = left ventricle.

Measuring Pitfalls
M-modes are easy to measure when the images are good, but during the learning phase when images are not optimum, there are several pitfalls to avoid. Whenever images are not ideal or you are not comfortable with the M-mode cursor angle through the heart, it is better not to make the measurement than to base a diagnosis on potentially erroneous information.
Breathing can create many artifactual motion abnormalities on the M-mode image. Figure 4.32 shows how wall and septal motions are altered secondary to respiration. This kind of motion is seen even if the animal is not panting. Momentarily placing a hand over the animal’s nostrils while three or four cardiac cycles are recorded on the M-mode can usually eliminate this artifact.
Figure 4.32 Respiratory motion causes artifactual wall and septal motion (arrows). RV = right ventricle, LV = left ventricle.

The most common problem during measurement of left ventricular M-modes is defining septal and wall boundaries. The right ventricular side of the septum is the hardest to define. Right ventricular hypertrophy with prominent papillary muscles and trabeculae, left ventricular dilation, or poor technique all contribute to ambiguity in identifying the right side of the septum (Figures 4.33, 4.34). Take care to identify and separate the right ventricular papillary muscle from the septum. Sometimes just paying attention to what the real time image looks like will allow identification of the true right side of the septum on M-mode images. When an M-mode has an ill-defined interventricular septum, move the image into a more horizontal position across the sector by sliding the transducer dorsal and cranial on the thorax in order to define the right ventricle and the septal boundaries better.
Figure 4.33 A papillary muscle is seen within the right ventricular chamber adjacent to the interventricular septum. Be careful not to include this muscle in septal thickness measurements. This image also shows a dilated left atrium (large arrows), which should normally be approximately the same size as the aorta (small arrows). RV = right ventricle, PM = papillary muscle, LV = left ventricle, AO = aorta, LA = left atrium.
Figure 4.34 (A) Papillary muscles within the right ventricle may create ambiguous definition of the right side of the septum. (B) Hypertrophy of the septum or right ventricular wall may also make definition of the right side of the septum difficult. (C) The right ventricular side of the septum is irregular and suggests that part of the tricuspid apparatus is included in the septal structures. (D) The line on the right ventricular side of the septum (arrow) may be part of the septum or may be chordae. Look to the real-time image for help in defining the septal boundary. RV = right ventricle, RA = right atrium, LV = left ventricle, AO = aorta, LA = left atrium.

The left ventricular wall is usually easier to obtain on M-modes, but at times chordae tendinae or papillary muscles may create ambiguous measuring points. Chordae tendinae generally follow wall motion, but they have a slower upward rate of motion during systole. Figure 4.35 shows how chordae may be included in wall thickness measurements unless attention is paid to both the two-dimensional image used to generate the M-mode and the details of the M-mode image itself. Papillary muscles appear as thick layers of muscle above the free wall, usually during systole, but sometimes throughout both phases of the cardiac cycle (Figure 4.36). If wall thickness appears to be greater than septal thickness and two-dimensional images do not support this finding, papillary muscle is probably included in left ventricular wall thickness measurements. Elongate the left ventricle by rotating the transducer or by lifting the transducer into a more horizontal position, creating better mitral valve motion. This will generally eliminate papillary muscle from the two-dimensional image.
Figure 4.35 Chordae tendinae (arrow) can mistakenly be included in left ventricular wall measurements. Chordae generally have a slower rate of rise during systole and can be differentiated from the wall based on this slower motion. RV = right ventricle, LV = left ventricle.
Figure 4.36 Papillary muscles appear as thickened areas along the top of the left ventricular wall. This is generally seen during systole and is discontinuous with the wall during diastole (large arrows) but may also be seen during diastole (small arrow) and can mistakenly be assessed as hypertrophy. RV = right ventricle, LV = left ventricle.
Assessment
Left ventricular diastolic dimension is used to determine the presence or absence of left ventricular volume overload. This measurement reflects maximum ventricular filling when the heart is relaxed. Systolic dimensions are a reflection of systolic function in the heart and should not be used to assess the presence or absence of dilation. The same principle applies to wall and septal thickness measurements. The presence or absence of hypertrophy should be determined from diastolic measurements of thickness. Systolic measurements are a reflection of systolic function, so increased

thickness during systole may simply reflect increased function as opposed to hypertrophy. Hypertrophy does increase systolic thickness but the effect of increased systolic function cannot be separated from the effects of hypertrophy. Application of these measurements will be made throughout the following chapters as the various cardiac disorders are discussed.
Evaluation of Chamber Size
Use diastolic LV dimension.
Assessment of Wall Thickness
Use diastolic VS and LVW thicknesses.
Use LVW to LVd ratio.
Right ventricular wall thickness and chamber size may be measured from left ventricular M-modes, but there is great variability in these measurements because of varying right ventricular conformations between animals. Values are available however and may be found in the appendices. Measure the right ventricular wall and chamber sizes at the same point in the cardiac cycle as left ventricular measurements are made. The leading edge theory of measurement is used.
Left ventricular diastolic chamber size to wall thickness ratio is used in man to assess the extent of compensatory hypertrophy during disease processes (79). This assessment of wall thickness can also been assessed using the reverse ratio of wall thickness to chamber size (80). The normal heart will have a wall thickness that maintains normal systolic stress on the heart. As the ventricle dilates, wall thickness should increase in order to maintain normal systolic wall stress (81).
Increased chamber size to wall thickness relationships suggest inadequate hypertrophy and increased wall stress while decreases suggest excessive hypertrophy (80–82). Equation 4.3 relates wall thickness and chamber size to wall stress as follows:
Equation 4.3 
where pressure is the systolic blood pressure, radius is the radius of the left ventricular chamber which equals 1/2 of the left ventricular end diastolic chamber dimension on echo, and wall thickness is the diastolic left ventricular wall thickness. In the presence of left ventricular volume overload, a normal ratio suggests appropriate compensatory hypertrophy and normalized wall stress. Dilated cardiomyopathy typically has a low ratio of wall thickness to chamber size creating high wall stress. Hearts with aortic stenosis or systemic hypertension should have increased wall thickness to chamber size ratios. The hypertrophy is an appropriate compensatory mechanism in response to the high afterload thus normalizing wall stress.
Several differences exist between species. In the dog and cat, the interventricular septum is typically only slightly thicker than the free wall. The horse however has a much thicker septum than free wall, and the difference is even more pronounced in the dressage horse when compared to jumpers and untrained horses (17). The excessive septal thickness is no longer visible in endurance horse (67,83). It is thought that as these hearts endure the stresses of exercise that the free wall has to deal with more stress since it is thinner than the septum and it will hypertrophy accordingly until its thickness is comparable to the septum. These extremely fit horses also have increased ventricular chamber sizes and, as a consequence, have greater reserve for exercising periods.
Greyhounds have increased left ventricular dimensions and wall thicknesses compared to other dogs of the same weight (48). This difference exists whether the greyhound is a racing or a nonracing
animal. In man the effects of exercise on the heart regress after several weeks of not exercising, but the increased dimensions and hypertrophy persist in these greyhounds despite a sedentary lifestyle (81).
Measurements of wall and septal excursions are a reflection of volume changes within the ventricular chamber. Greater volume changes create greater wall and septal excursion than smaller volume changes.
When the left ventricle is volume contracted for any reason, wall motion abnormalities become evident, which can mimic cardiac disease. If measurements of ventricular size are smaller than normal and the animal is possibly dehydrated, or has any reason to be volume contracted, repeat the echo exam after the volume-depleted state has been corrected.
Left ventricular function is calculated from the measurements of left ventricular size during systole and diastole. This is discussed later in this chapter.
Mitral Valve
Measurement
Before the advent of Doppler echocardiography, the mitral valve M-mode was analyzed for rate of opening and closing as well as excursion distances. Normal ranges for these parameters are very wide since the effects of heart rate and pressure differentials on how fast or slow the valve opens and closes are pronounced. Two-dimensional and Doppler echocardiography have provided greater accuracy in assessing movement and flow through the valve. Mitral valve M-modes are still valuable however for detecting subtle movement alterations created by altered flow through and around the valve. Systolic anterior motion and diastolic flutter are two findings that are easily seen on M-mode images and in the absence of Doppler provide important hemodynamic information. They will be discussed in the following sections and chapters.
One very consistent and popular mitral valve measurement is the E point to septal separation (EPSS) (Figure 4.37). The EPSS is the shortest distance from the E point of the mitral valve to the ventricular septum.
Figure 4.37 The only routinely measured parameter from mitral valve M-modes is the E point to septal separation (EPSS) (1). RVW = right ventricular wall, RV = right ventricle, IVS = interventricular septum, LV = left ventricle, MV = mitral valve, LVW = left ventricular wall.

Assessment
The EPSS measurement is easy to make and is an indicator of left ventricular filling and function. Cardiac pathology may increase, decrease, or not affect EPSS, but EPSS has strong negative correlation to ejection fraction in the absence of aortic and mitral insufficiencies (Figure 4.38) (84). This correlation to ejection fraction is based upon the fact that flow into the ventricle is equal to flow leaving the ventricle. In the presence of high diastolic left ventricular filling pressure, such as in dilated cardiomyopathy, flow from the left atrium to the left ventricle is reduced and consequently flow out of the left ventricle is also reduced.
EPSS
Indicator of left ventricular filling and function
Increased EPSS = decreased ejection fraction
Normal canine EPSS = <7.7 mm
Figure 4.38 The large E point to septal separation (EPSS) (arrows) on this M-mode is indicative of poor cardiac output. RV = right ventricle, P = papillary muscle, VS = ventricular septum, LV = left ventricle, LVW = left ventricular wall, E = early diastolic mitral valve motion, A = late diastolic mitral valve motion.

Studies in man and dogs have shown that EPSS accurately separates normal from abnormal left ventricular function regardless of left ventricular size when dilation is present (85). Hypertrophy however restricts valve motion and may decrease EPSS. EPSS is also valid for assessing left ventricular function in the presence of abnormal septal motion (86).
EPSS shows a very weak correlation to BSA and weight in some studies and no correlation in others, so body size is generally not considered when assessing normal EPSS values. While an inverse correlation of EPSS to heart rate has been shown in one study, another shows no effects of breed, age, sex, mass, or heart rate on EPSS (84). Any correlation is weak and is probably not significant enough to warrant adjustment of normal values for the animal’s weight or heart rate.
Left Atrium and Aorta
Measurement
The most common method of measuring the left atrium is on M-mode images at the largest left atrial dimension at end systole from the top of the posterior aortic wall to the top of the pericardium (Figure 4.39). Left atrial wall thickness is generally not recorded well, and the pericardium provides a consistent easily visualized atrial boundary. Although the left atrium may enlarge in planes other than that recorded for M-mode images, it is generally a clinically useful indicator of left atrial size. Because the left atrium can dilate in planes other than the ones used for this M-mode measurement, the absence of dilation should not be based upon this number alone. Two-dimensional measurements of left atrial size provide valuable additional information.
Figure 4.39 Measurements obtained from aortic root and left atrial M-modes include the following:
(1) aorta, (2) pre-ejection period, (3) left ventricular ejection time, and (4) left atrium. See the text for details. RA = right atrium, AO = aorta, AOV = aortic valve, LA = left atrium.

The aorta is measured from the top of the anterior aortic wall to the top of the posterior wall at end diastole. Ideally two aortic valve cusps should be seen in order to minimize angle problems.
Left ventricular ejection time is measured at the aortic valve from the time it opens to the time it closes (Figure 4.39). A perfect aortic valve is not required, but clear definition of when it opens and when it closes is necessary.
Pre-ejection periods can only be measured when an electrocardiogram is used on the echocardiogram. The measurement is made from the beginning of the QRS complex to where the aortic valve opens (Figure 4.39). This time period is very similar to the isovolumic contraction period where both the aortic and mitral valves are closed and the ventricle is building up enough pressure to open the aortic valves.
Assessment
There is a positive correlation between aortic and left atrial dimensions with weight and BSA, in dogs and cats, and a ratio of left atrium to aortic root size may be used as an indicator of how severe the atrial dilation is. This is usually a reliable value since the aorta usually maintains a fixed relationship

with the chambers. (87). It is wise to assess aortic root size before using the ratio. A small aorta may be seen in animals with low output failure, and the left atrium to aortic root ratio will reflect greater left atrial enlargement than is actually present.
Left atrial size is very similar to aortic root size in dogs (range LA/AO = .83–1.13), while in cats the left atrium may be much larger than the aorta (range LA/AO = .88–1.79). In horses the left atrium is generally smaller than the aortic root (range LA/AO = .67–.75). In neonate foals left atrial size is larger than it is just hours later after the ductus and foramen have closed. This trend is also seen in man and presumably in other species as the volume load on the heart decreases (65). Aortic root size has been shown to be higher in endurance horses, whether this is secondary to increase ejection fraction is not known (69). Assessment of the systolic time intervals is discussed later in this chapter under systolic function.
Normal LA:AO
Canine
.83–1.13
Feline
.88–1.7
Equine
.67–.75
Ratio Indices
There are instances when the subjective assessment and the quantitative assessment of ventricular and atrial sizes do not match. This is especially true in giant and small breeds and in overweight animals (88,89). M-mode dimensions of each parameter are divided by either the pure aortic root M-mode measurement or a weight-based aortic value. The weight-based aortic index is calculated as follows (Equation 4.4):
Equation 4.4 
where W = the weight in kilograms, and k = a constant for each species (dogs = .795, cats = .567, and horses = 1.043). The constant was derived from the average value in each species of the raw aortic root measurement divided by W1/3. The weight-based aortic root measurement is similar to using BSA as a correlation except that it is a linear assessment versus an area assessment. BSA is calculated as (Equation 4.5):
Equation 4.5 
where k is a constant in dogs equaling 0.101 and weight is in kilograms (89).
M-mode Ratio Indices
May be more accurate in unusual body types
Giant breeds
Obese or very lean animals
Athletes
Let’s use a 45-kilogram dog with an M-mode derived left ventricular diastolic chamber size of 41 mm and an aortic size of 30 mm as an example of the weighted assessment method.