


Color-Flow Doppler
Introduction
Color-flow Doppler has added an entirely new dimension to echocardiography. It has eliminated much of the time-consuming search for small insufficient jets with spectral Doppler, allows proper alignment with all valvular flows, and when properly used, echocardiographic interpretations can be made with the added confidence that nothing has been missed.
Controls
The most common color-flow controls are discussed here. Each manufacturer has their own specific set of color-flow features. Refer to the owner’s manual for more detailed information regarding individual equipment.
Gain
Color-flow gain adjusts the system’s sensitivity to received color information. Unlike gain or power controls for two-dimensional imaging, the gain control for color-flow Doppler does not affect output power, it just affects receiver gain. Increasing the color gain will increase the amount of color shown on the image. When the gain is turned up too high, speckling or noise will appear throughout the color wedge (Figure 3.16). This is different than the mosaic pattern seen with turbulent flow since it is not a discrete jet and is not confined to the blood-filled areas of the heart and vessels. Adjust the gain until just before speckling noise begins to appear.

Figure 3.16 Color gain is too high when speckling is superimposed upon the myocardium. (A) The jet of aortic regurgitation is clearly defined when gain is set correctly (B) while it is ill defined and noisy when color gain is set too high. RV = right ventricle, LV = left ventricle, LA = left atrium, AO = aorta.
Color Sector Width and Height
This adjusts the size of the color wedge (Figure 3.17). The color sector can be increased to fill the entire real-time sector. Reducing the color sector width increases frame rate since less time is required to process flow information. Alternately, increasing color width decreases frame rate and reduces the temporal accuracy of color-flow information especially in patients with high heart rates. The black and white image can be suppressed as well, leaving just the color wedge and the background real-time information (Figure 3.17).
Figure 3.17 The depth of color superimposed upon the two-dimensional image may be adjusted. Reducing the depth does not affect frame rate but does eliminate extraneous information beyond the area of interest. The width of the color sector can also be adjusted. (A) Larger color sectors decrease frame rate and reduce the temporal accuracy of color-flow information, creating a blurring effect especially in patients with high heart rates. Larger color sectors may also be overwhelming. (B) A
small color sector increases the frame rate and improves color-flow information.
Changing the height of the color sector usually does not affect frame rate on most machines. It does however eliminate extraneous information above or below the area of interest.
Color Map
The color map allows selection of reconfigured color-flow presentations. As noted in Chapter 1 all information in this book will use the blue away and red toward (BART) color map, which uses the blue away and red toward configuration. Other maps include RABT (red away and blue toward) and pastel maps. Turbulent flow may be displayed with either an enhanced or a variance display. The underlying laminar flow is still encoded with a BART display, but the disturbed flow is displayed with different characteristics. An enhanced map encodes the varying velocities of turbulent flow with different colors producing a mosaic of reds, blues, yellows, and cyans. A variance map mixes green into the areas of disturbed flow (see Chapter 1). The result is yellow when green mixes with red and cyan when green mixes with blue.

Threshold or Tissue Priority
This control assigns the gray level at which color-flow information stops. A high priority for tissue will display very little color. Use the lowest tissue priority possible in order to get good color filling. A threshold that is too low will cause bleeding of the color over myocardial structures (Figure 3.18).
Figure 3.18 A high priority (threshold) for tissue will display very little color. (A) Set tissue priority in order to get good color filling in the chamber or vessel. (B) Improperly set threshold (priority) causes bleeding of the color over myocardial structures.
Color-Flow Processing
The way color information is acquired and processed is usually an operator-controlled feature. Each line of color-flow information may be sampled for variable lengths of time (see Chapter 1). A large packet size corresponds to a longer period of time, decreased frame rate, many color samples, and high quality color. The reduced frame rate however may create temporal artifacts with the high heart rates of veterinary patient imaging. Medium packet sizes produce faster imaging rates but shorter sampling times and possibly a lower quality color image. These are generally appropriate for cardiac
imaging with average heart rates. Small packet sizes result in the fastest frame rates, but very little time is spent gathering flow information. Select large packet sizes for high quality color images and medium packet sizes for higher frame rates and excellent resolution.
Filters are also an operator-controlled feature of color-flow processing. Filters remove highintensity, low-velocity information from the image. High filter settings remove most of the low velocity signals and are often used to eliminate the strong but low-velocity information received from wall and valve motion. Applying a low filter only removes some of the high-intensity signals and so low-flow velocities are seen well. Cardiac imaging usually requires medium to large packet sizes and medium to low filter settings.
Baseline
Adjusting the baseline on the color bar allows higher velocities to be displayed in one direction before aliasing occurs. This control is primarily used to “unwrap” aliased signals (Figure 3.19). A number at the top and bottom of the color bar represents the maximum detectable velocity before color aliasing occurs. Moving the baseline up or down will double the maximum detectable velocity for blood flow away or toward the transducer.
Figure 3.19 Adjusting the scale on the color bar allows higher velocities to be displayed before aliasing occurs. (A) Pulmonary artery systolic flow is aliased in this image where the Nyquist limit (PRF) (arrow) is set at .64 m/sec. (B) A Nyquist limit of .80 m/sec eliminates the aliased signal, and semiquantitatively a normal pulmonary artery flow velocity is determined.

Persistence or Frame Averaging
Persistence averages old sector frame information with new sector frame information in order to display smooth images. This reduces image noise because the equipment’s analyzer assumes the difference between the two frames is mostly noise thus eliminating it from the displayed image. Too much persistence creates a blurred effect, and frame averaging is usually set very low during cardiac exams.
Normal Color-Flow Images
Introduction
Color-flow imaging is best done with low-frequency transducers. Try a lower frequency transducer if color does not fill the chambers interrogated. Color-flow imaging of the deeper structures in large animals may not be possible. Decrease two-dimensional sector size, decrease color sector size, increase frame rate, increase persistence, decrease tissue priority, and decrease transducer frequency to improve color-flow mapping in large animals and in small animals if a low-frequency transducer is not available. Tipped apex up imaging planes in both large and small animals improves color-flow

mapping since flow is more parallel with the Doppler sound beams.
Color-Flow Doppler
Aliasing occurs at lower velocities than with spectral Doppler.
Color aliasing may occur when flow is laminar.
Use lower frequency transducers for best color-flow imaging with less aliasing.
Use a small color sector to reduce temporal artifacts.
Aliasing occurs at lower velocities with color-flow Doppler because of the low PRF required. Normal flow may sometimes have aliased signals as a result. This results in a wrapping around effect where the blues moving away from the transducer are layered with reds after the Nyquist limit is exceeded and the red moving toward the transducer in normal flow is layered with blue. The layering is generally seen in the middle of the flow jet while the periphery of the color-flow profile remains true to its flow direction (Figure 3.20). Figure 3.21 shows a series of images for flow in the pulmonary artery. Early flow velocities exceed the Nyquist limit and have almost completely “wrapped” to a red color even though flow is down away from the transducer. As flow velocity decreases just past the middle of systole and velocities start to equal the Nyquist limit, blues are shown in the image. The latter part of systole shows only blues when flow velocity has decreased and no longer exceeds the Nyquist limit.
Figure 3.20 Color wraps around the color bar when velocities exceed the Nyquist limit of 41 cm/sec. When flow is laminar but exceeds the limit, a layering effect is seen. Here tricuspid inflow displays red at the periphery but has a middle yellow layer and as flow velocity increases in the center, color aliases to blue. RV = right ventricle, IVS = interventricular septum, LV = left ventricle, RA = right atrium, LA = left atrium.
Figure 3.21 This series of images shows flow within the right ventricular outflow tract and pulmonary artery. (A) Initial velocities exceed the Nyquist limit of 64 cm/sec (see color bar), and although flow is down and away from the transducer, it is primarily red. (B) As flow starts to decelerate, blues start
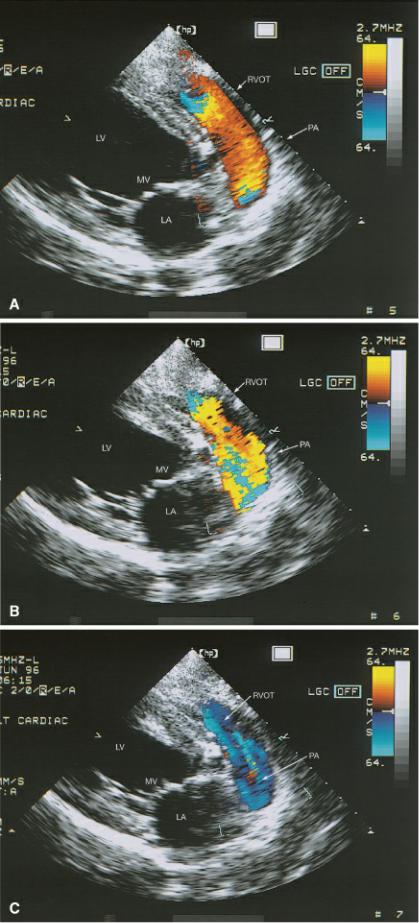
to be superimposed upon the red. (C) Finally toward the end of systole when flow has decreased to less than 64cm/sec, the aliasing is barely seen in the center of the artery. RVOT = right ventricular outflow tract, PA = pulmonary artery, LV = left ventricle, MV = mitral valve, LA = left atrium.

Turbulent flow results in disorganized and greatly variant velocities. When turbulent flow is detected, green is added to the areas of disorganized flow if a variance map is used and a blue red yellow white mosaic is seen when using enhanced maps (Figure 3.22). This mosaic pattern is easy to detect and is useful in identifying areas of abnormal flow. Low-velocity flows are generally not detected and no color is assigned. These areas will remain black.
Figure 3.22 When turbulent flow is detected and it exceeds the Nyquist limit, the disorganized cellular movement creates a mosaic pattern on the color-flow image. Here a mosaic jet of mitral insufficiency is displayed. RV = right ventricle, RA = right atrium, TV = tricuspid valve, IVS = interventricular septum, LV = left ventricle, MV = mitral valve, LA = left atrium, MR = mitral regurgitation, LVW = left ventricular wall.
Tipped long-axis views (apex up, base down) and apical fourand five-chamber views are the best for imaging color-flow Doppler since the Doppler beams are aligned better with flow direction (Figure 3.23). Images that align the interventricular septum horizontally across the sector may produce good color images depending upon depth and transducer frequency however. The color encoded twodimensional images will be different depending upon the image generated. For example a tipped view with the apex up will have color flowing through the heart with exactly the opposite colors of what would be seen if the image were generated with the apex down and base up toward the top right of the sector. Try several transducer positions in order to find the optimal plane for color-flow imaging of specific structures.
Color-flow imaging is usually better with images that align flow in relatively up and down directions.
Figure 3.23 Angled long-axis views (apex up, base down) and apical fourand five-chamber views are the best for imaging color-flow Doppler since the Doppler beams are aligned better with flow direction. The color-flow information varies in this series of images from (A) poor color filling in a horizontally oriented image to good (B) on angled and (C) apical images. RV = right ventricle, LV = left ventricle, LA =left atrium, RA = right atrium, AO = aorta, VS = ventricular septum, LVW = left ventricular wall.

Mitral Valve and Tricuspid Valve Flow
Horizontally aligned parasternal long-axis four-chamber or left ventricular inflow outflow images, and apical fourand five-chamber views will show left ventricular inflow though the mitral valve as

red with a brighter central area. When the Nyquist limit is exceeded the central area of flow may have a layer of blues superimposed upon it (Figures 3.24, 3.25, 3.26, 3.27). The same is true for tricuspid flow (Figures 3.28, 3.29, 3.30). Since in the parasternal images tricuspid flow is not as deep, the Nyquist limit is higher and aliasing will not occur as readily. Trivial to mild tricuspid regurgitation is commonly seen in all animals (Figure 3.31).
Figure 3.24 Flow from the left atrium into the left ventricle on this right parasternal long-axis left ventricular outflow view in a cat is red since flow is directed upward in this tipped view. RV = right ventricle, IVS = interventricular septum, AO = aorta, LV = left ventricle, LVW = left ventricular wall, LA = left atrium.
Figure 3.25 Flow from the left atrium into the left ventricle on the right parasternal left ventricular outflow view in this dog has a layered central flow area, which is at the threshold of aliasing. RV = right ventricle, LV = left ventricle, AO = aorta, AOV = aortic valve, LA = left atrium, IVS = interventricular septum, MV = mitral valve.

Figure 3.26 The depth required for color-flow mapping of mitral inflow in this right parasternal fourchamber view in the horse shows less color filling at the bottom of the sector. The Nyquist limit is also lower (41 cm/sec) because of the depth requirements. RV = right ventricle, RA = right atrium, IAS = interatrial septum, IVS = interventricular septum, LV = left ventricle, LVW = left ventricular wall, MV = mitral valve, LA = left atrium.
Figure 3.27 This transmitral has a central bright yellow core superimposed upon slower red flow at the periphery of the jet as it moves up from the left atrium into the left ventricle in this apical fourchamber view in a dog. LV = left ventricle, IVS = interventricular septum, RV = right ventricle, RA = right atrium, LA = left atrium.
Figure 3.28 Tricuspid flow in this right parasternal tipped left ventricular outflow view in a horse shows central velocities that are just starting to exceed the Nyquist limit of 41 cm/sec. IVS = interventricular septum, RV = right ventricle, RA = right atrium, LV = left ventricle, AO = aorta.
Figure 3.29 The left parasternal cranial long-axis view of the right atrium and auricle generally do not show flow within the right auricle. RV = right ventricle, RAU = right auricle, LV = left ventricle, IVS = interventricular septum.
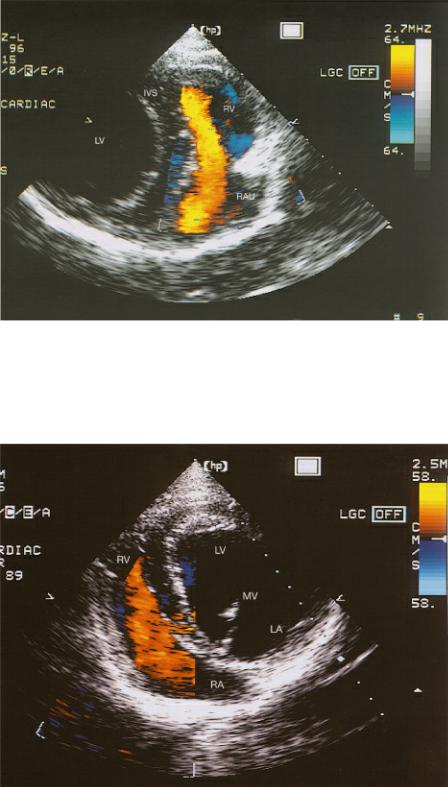
Figure 3.30 Tricuspid flow during mid-diastole in this modified apical four-chamber view is slow and well below the Nyquist limit of 58 cm/sec. LV = left ventricle, RV = right ventricle, MV = mitral valve, LA = left atrium, RA = right atrium.
Figure 3.31 Trivial to mild amounts of tricuspid insufficiency are common in all animals. Here a trivial amount of tricuspid regurgitation (arrow) is seen on this right parasternal long-axis left ventricular outflow view in a horse. RV = right ventricle, RA = right atrium, TV = tricuspid valve, LV = left ventricle, AO = aorta, LA = left atrium, MV = mitral valve.

Aortic Flow
Aortic flow is displayed in hues of blue with red aliasing as blood leaves the left ventricle in a downward direction in the apical five-chamber view (Figure 3.32). The depth of the aorta in this view usually results in a low Nyquist limit and “wrap around” or aliasing is usually seen. Parasternal views of the aorta may have flow mapped as either red or blue depending upon the angle at which it is aligned with the transducer (Figures 3.33, 3.34). The color usually changes as the aorta curves away from the heart.
Figure 3.32 Aortic flow generally has an aliased signal since the Nyquist limit is almost always exceeded. Here aortic flow in the (A) horse on an apical five-chamber view shows bright yellow and red aliased flows even though flow is away from the transducer. (B) This apical five-chamber view in a dog during early systole when velocities are high shows an almost completely aliased signal. (C) Later in systole during deceleration much of the flow is accurately mapped as blue. RV = right ventricle, LV = left ventricle, MV = mitral valve, LA = left atrium, TV = tricuspid valve, RA = right atrium, AO = aorta.

Figure 3.33 Aortic flow in this horizontal right parasternal long-axis left ventricular outflow view in a horse is (A) red when flow enters the outflow tract and (B) blue when it turns away from the transducer. A trivial amount of tricuspid regurgitation is seen (arrow). RV = right ventricle, RA = right atrium, IVS = interventricular septum, LV = left ventricle, AO = aorta, LA = left atrium, MV =

mitral valve, TV = tricuspid valve.
Figure 3.34 Aortic flow in this right parasternal left ventricular outflow view in a cat is accurately shown, without aliasing, in reds and yellows. RV = right ventricle, IVS = interventricular septum, LV = left ventricle, LVW = left ventricular wall, AO = aorta, LA = left atrium, MV = mitral valve.

Pulmonary Artery Flow
Pulmonary artery flow encoded upon the transverse image at the base of the heart in either the left or right parasternal views is usually blue as blood leaves the right ventricle in a direction away from the transducer. Because the artery curves in this plane, there is typically layering of colors within the pulmonary artery flow profile (Figures 3.35, 3.36). Total reversal of color is seen as flow progresses from low velocity during early systole to higher velocity in mid systole to slower velocity at the end of systole (Figure 3.19). Trivial to mild pulmonic insufficiency is often seen in both large and small animals (Figure 3.37).
Figure 3.35 Flow in this right parasternal transverse image of the pulmonary artery in a horse shows mild aliasing (yellow) during late systole. RV = right ventricle, RVOT = right ventricular outflow tract, RA = right atrium, AO = aorta, PA = pulmonary artery.
Figure 3.36 Early systolic flow mapping within the pulmonary artery generally shows an aliased