


Eccentric jets can limit the ability to assess severity. Jets that slide along a lateral wall of the receiving chamber flatten out because of the Coanda effect. This reduces spread into the chamber. These eccentric jets will appear much smaller than jets of comparable severity that are centrally directed (1). Color-flow Doppler regurgitant jet areas are also affected by driving pressure. Jet area increases and decreases with changes in driving pressure. Therefore, it is important to measure blood pressure and take medications into consideration when assessing regurgitant severity (1). The evaluation of valvular regurgitation by echocardiography must consider the patient’s clinical status. Physiologic changes can alter the results between echocardiographic examinations of the same patient
(1). The following chapter covers the use of these various echocardiographic modalities as they apply to acquired valvular insufficiencies.
Mitral Regurgitation
Many clinically normal animals have small insignificant regurgitant jets at one or more valves. Physiologic mitral valve insufficiency in animals is less common than insufficiencies at the other cardiac valves. Both the size and duration of valvular leaks help differentiate between physiologic and pathologic regurgitation. Physiologic regurgitation has low velocity, occupies a small area behind the

valve, and rarely encompasses the entire portion of systole or diastole (2). These small leaks are often associated with valve closure and are called trace regurgitation or mitral closing volume (1–5).
Physiologic Regurgitation
Has low velocity
Has a weak flow profile
Is trivial in size just behind the valve
Is generally nonturbulent
Is not holosystolic or holodiastolic
Studies show that anywhere from 26 to 68% of horses have clinically insignificant mitral insufficiency (3–6). These mitral leaks are elliptical in shape on color-flow exams, with a length of 34
± 13 mm and a width of 1.9 ± 1.3 mm. These jets were only seen on left parasternal long-axis views
(3). This may be because less depth is required on the left side and the angle can be accentuated in order to optimize color flow.
Trace to mild MR seen in:
10% of normal healthy dogs
26–68% of normal healthy horses
Trace to mild mitral insufficiency is seen in up to 10% of normal healthy dogs. A small nonturbulent flow area located proximal to the mitral valve leaflets during early systole usually represents backflow secondary to valve closure. This usually lasts for a very short time (<50 msec or so) (Figure 4.53) (7).
Two-Dimensional and M-mode Evaluation
Valvular Appearance and Motion
Degenerative Lesions
Acquired mitral valvular insufficiency usually develops secondary to degenerative disease. The typical characteristics of myxomatous degeneration include left ventricular and atrial dilation, wall and septal hypertrophy, increased thickness, nodularity and prolapse of one or both mitral valve leaflets, elevated parameters of systolic function, and hyperdynamic wall and septal motion. Less common features include pericardial effusion, lack of hypertrophy, decreases in systolic function and ruptured chordae tendineae.
The degenerative mitral valve changes eventually prevent proper leaflet alignment and closure. The lesions are generally smooth and small creating a club-shaped appearance to the leaflet tips during early stages of the disease but may become large and irregular as the disease progresses (Figures 5.2, 5.3, 5.4) (8). Generally, but not always, larger lesions are associated with more severe insufficiency. Large breed dogs with acquired mitral valve insufficiency seem to have fewer observable changes of the valve leaflets despite significant regurgitation (9,10). Prolapse may be observed without any abnormal thickness or irregularity of the leaflets (9).
Figure 5.2 Slight rounding and curling (arrows) at the tips of the mitral valve leaflets are consistent
with early degenerative changes. RV = right ventricle, IVS = interventricular septum, LV = left ventricle, LVW = left ventricular wall, LA = left atrium, RA = right atrium.
Figure 5.3 Mitral valvular lesions may become very large and irregular (arrow). Echocardiography cannot differentiate between degenerative and vegetative lesions. Bowing of the interventricular and atrial septums toward the right indicates dilation of both the left ventricle and atrium. RV = right ventricle, RA = right atrium, LV = left ventricle, LA = left atrium.
Figure 5.4 A thick irregular mitral valve is seen in this right parasternal long-axis left ventricular inflow outflow view of the heart. Left atrial enlargement is present based upon a large left atrial to aortic root ratio. The interventricular septum is not curved upward despite left ventricular dilation because the right ventricle is also dilated keeping the pressure relationship similar to normal. RV = right ventricle, RA = right atrium, LV = left ventricle, LA = left atrium, AO = aorta.

The identification of lesions is gain, depth, and transducer dependent. It is good to compare the leaflets to other structures at that approximate depth. The thickness of the endocardial echoes is used to assess leaflet thickness in man. They should be similar (11). When mitral lesions are small, be careful to interrogate several planes since chordal attachments to the leaflets are difficult to distinguish from lesions (Figure 4.9) (12). Right parasternal four-chamber views of the heart are excellent for imaging the mitral valve (Figure 5.3). The left ventricular inflow outflow view is also good, but the valves may appear to be thicker than they truly are if the imaging plane is not perfect. The sound beam needs to be directed through the center of the annulus, and to do so the probe needs to be lifted up toward the animal’s thorax creating a clean left atrium with leaflets that move and open well into the left ventricle. Transverse images of the valve are useful for identifying large lesions, but they can be misleading when looking for small ones (Figure 5.5).
Take care not to identify chordal attachments as lesions.
Figure 5.5 Transverse images may show mitral lesions well (arrow), but care must be taken because artifactual thickening may be seen in these planes. LV = left ventricle.

The nodular leaflets appear shaggy and irregular on M-mode images (Figure 5.6). Although it is not common, there may be systolic fluttering of the mitral valve on M-mode images as the regurgitant jet flows through it (8). When lesions are large the thickness of the mitral valve on the image masks the fluttering.
Figure 5.6 M-mode images of the mitral valve with degenerative lesions show irregular shaggy lines (arrow). RV = right ventricle, VS = ventricular septum, LV = left ventricle.
Ruptured Chordae Tendineae
Degenerative mitral valve disease is the most common cause of ruptured chordae tendineae in the dog. Rarely does vegetative growth of the mitral valve result in ruptured chordae tendineae (13). The mitral valve has primary or first order chordae tendineae, which attach the tips of the leaflets to the papillary muscles and are responsible for most of the structural integrity of the valve. Secondary and tertiary

chordae tendineae attach the midventricular portions of the valve leaflets and the commissural area of the leaflets to the papillary muscles and ventricular walls (13). The majority of dogs with echocardiographic evidence of ruptured chordae tendineae have severe mitral insufficiency based upon color-flow Doppler evaluation of regurgitant jet size and heart failure class (13,14). Most instances of ruptured chordae affect the septal leaflet of the mitral valve, and rupture of chordae to the parietal (posterior) leaflet is much less common (13).
Rupture of a chordae tendineae resulting in a flail leaflet is diagnosed when the leaflet points back into the left atrial chamber during systole (Figures 5.7, 5.8, 5.9) (15–17). During diastole the leaflet may sometimes bend back on itself within the left ventricular outflow tract (Figures 5.10, 5.11) (16). The mitral valve shows chaotic motion during diastole and systole on both M-mode and real-time images after a chordae has ruptured (Figure 5.12) (8,15,16,18,19). These findings are seen on both parasternal and apical images (16). Minor chordal rupture may be seen in only one echocardiographic plane while major chordal rupture tends to be seen in several imaging planes (11). The color-flow jet of mitral regurgitation caused by chordal rupture is usually eccentric (11). When Doppler confirms the presence of severe mitral insufficiency without the concurrent left ventricular and atrial dilation seen in a chronic process, look for a ruptured chordae (Figure 5.13).
Figure 5.7 A flail mitral valve leaflet is seen pointing back into the left atrium in this parasternal four-chamber view of the heart (arrow). RV = right ventricle, LV = left ventricle, LA = left atrium, PV = pulmonary vein, MV = mitral valve.
Figure 5.8 The septal mitral valve leaflet is seen pointing back toward the left atrial chamber on this apical five-chamber view, a sign that a major chordae has ruptured (arrow). LV = left ventricle, LA = left atrium, RV = right ventricle, AO = aorta, RA = right atrium.

Figure 5.9 This modified apical five-chamber view of the heart shows a flail parietal (posterior) leaflet (arrow). LV = left ventricle, RV = right ventricle, AO = aorta, LA = left atrium, RA = right atrium, AO = aorta.
Figure 5.10 The septal mitral valve leaflet and chordae are seen bent back into the left ventricular outflow tract during diastole in this image of a ruptured chordae tendinae (arrow). LV = left ventricle, LA = left atrium.

Figure 5.11 A ruptured chordae is seen flailing within the left ventricular chamber on this apical fourchamber view (arrow). LV = left ventricle, LA = left atrium, RV = right ventricle, RA = right atrium.
Figure 5.12 Mitral valve motion varies from beat to beat when a major chordae is ruptured. At times, the ruptured chordae may be seen within the left ventricular outflow tract above the leaflets (arrow). RV = right ventricle, MV = mitral valve.

Figure 5.13 When Doppler examination reveals severe mitral insufficiency without concurrent ventricular and atrial dilation, a ruptured chordae should be suspected. Here a color jet of severe mitral insufficiency fills the left atrial chamber of a dog with a ruptured chordae. Notice the normal left ventricular and atrial sizes. RV = right ventricle, LV = left ventricle, AO = aorta, LA = left atrium.
Mitral valve prolapse associated with chordae rupture is described in the horse. No obvious flailing leaflet was seen, and the prolapse was not visualized in all planes (20).
An eccentric regurgitant jet implies the presence of prolapse or flail leaflets.
Papillary muscle rupture occurs. This is usually a consequence of trauma (21). M-mode echocardiography shows an abnormal mass moving within the left ventricular chamber, but twodimensional images provide clear visualization of the torn muscle and its movement within the

chamber. The two-dimensional echocardiographic features of papillary muscle rupture include visualization of a portion of the papillary muscle attached to the chordae tendineae, severe mitral valve prolapse or flail leaflets, and abnormal appearance of the papillary muscle where the tip of it has torn off (22).
Mitral Valve Prolapse
Mitral valve prolapse (MVP) may be primary or secondary. Primary MVP results from intrinsic abnormalities of the mitral valve leaflets, usually myxomatous degeneration. Secondary MVP is present without inherent pathologic valvular abnormalities. This is typically secondary to hemodynamic causes such as volume contraction and reduced left ventricular size or myocardial disease resulting in akinetic muscle and abnormal papillary muscle function. When secondary or tertiary chordal rupture is present, the body of the leaflet billows back into the atrial chamber and only prolapse is appreciated (11). When both mitral valve leaflets are involved in the degenerative process with either valvular prolapse or irregularity, the prognosis for survival becomes poorer (23). In dogs, prolapse of the mitral valve is usually secondary to myxomatous degeneration of the leaflets, chronic stretch of the chordae tendineae and redundancy into the atrium during systole. Mitral valve prolapse may be seen without any evidence of insufficiency and seems to be genetically influenced in Cavalier King Charles Spaniels (CKCS) and Dachshunds (24–27). These dogs tend to show prolapse as early as 3 years of age without any clinical signs or murmurs and have a high incidence of mitral valvular insufficiency later in life. Of 19 CKCS dogs with mitral valvular insufficiency in one study, 84% had MVP. Three-year-old Dachshunds without heart murmurs had a 47% incidence of MVP.
MV prolapse can be secondary to:
Degenerative valve disease
Or hemodynamic causes
Akinetic or dyskinetic myocardium
Abnormal papillary muscle function
The course of MVP in man is usually benign but this is not so in dogs where there is a greater incidence of degenerative valvular disease (28,29). Dogs have more significant insufficiency and higher classes of heart failure with mitral valve prolapse (24,26).
The diagnosis of MVP is made when one or both leaflets buckle back toward the left atrium during systole. The mitral valve annulus is identified by a line drawn from the base of the aortic valve to the point of attachment of the parietal mitral valve leaflet on right parasternal long-axis left ventricular outflow views or by a line joining the attachment points of both mitral leaflets on right parasternal four-chamber views (Figures 5.14, 5.15) (27). Normally, the body of the mitral valve leaflets does not extend beyond the line into the left atrium (12). Buckling of either leaflet into the atrium beyond this line indicates mild mitral valve prolapse. A line drawn further back into the atrium from the dense echogenic area at the lower part of the atrial septum to the atrioventricular junction behind the posterior mitral valve leaflet represents the border between mild and severe prolapse (Figures 5.16, 5.17) (12,24,26,27). One study showed that the diagnostic accuracy of detecting mitral valve prolapse increases with experience (20). Apical four-chamber views are not recommended for the diagnosis of MVP in man, since this plane through the mitral annulus shows normal curving of the anterior leaflet into the left atrium. Only when the septal leaflet bends greater than 1 cm into the left atrium on apical four-chamber views is it considered abnormal in man. Posterior leaflet buckling in the apical four-

chamber view is always abnormal however. For this reason, parasternal left ventricular long-axis views are recommended in man (11). The accuracy of diagnosing MVP on apical four-chamber views has not been studied in animals.
Figure 5.14 Mitral valve prolapse is diagnosed when one or both leaflets buckle back into the atrium beyond a line defined by the attachment points of each leaflet. The prolapse here is mild (arrow). RV = right ventricle, LV = left ventricle, AO = aorta, LA = left atrium.
Figure 5.15 Mitral valve prolapse may also be identified on parasternal four-chamber images. The leaflets must buckle into the atrium beyond a line connecting the attachment points of both leaflets. This prolapse is mild (arrow). RV = right ventricle, LV = left ventricle, RA = right atrium, LA = left atrium.

Figure 5.16 Severe mitral valve prolapse (arrow) is present in this image. RV = right ventricle, VS = ventricular septum, LV = left ventricle, LVW = left ventricular wall, LA = left atrium, AO = aorta.
Figure 5.17 Here severe mitral valve prolapse is seen on a right parasternal left ventricular outflow view (arrow). RV = right ventricle, LV = left ventricle, AO = aorta, LA = left atrium.
Mitral valve prolapse has been seen and described in the horse (3). There is a bent or curved configuration to the body of the leaflet when closed (3). There was no associated valvular lesions or regurgitation with the prolapse.
Left Ventricular Size
Volume overload of the left atrium and ventricle is seen with hemodynamically significant chronic mitral valvular insufficiency (Figures 5.3, 5.4, 5.7, 5.16, 5.17) (8). The degree of left atrial enlargement is often used as an indicator of stage of heart failure based upon New York Heart
Association criteria. The atrial sizes of dogs in stage 3 and 4 of the NYHA criteria are significantly larger than the atria of stage 2. Left atrial sizes of dogs in stage 2 failure were significantly larger than the atria of dogs with no heart failure or stage 1 heart failure. There is no difference between the atrial sizes of dogs with stage 1 heart failure and no heart failure (30). Significant insufficiencies without the concurrent chamber enlargement are suggestive of an acute process and ruptured chordae (Figure 5.13). Left atrial to aortic root ratios of greater than 1.7 have been found to be a poor prognostic indicator for survival (23). In dogs with normal systolic function or mildly depressed systolic function, the degree of left atrial dilation correlates well with severity of the regurgitant volume (31).
Suspect ruptured chordae tendineae when color-flow evidence of regurgitation is severe, but volume overload is not significant.
Figure 5.18 The left auricle is seen next to the left ventricular chamber on parasternal transverse images of the left ventricle when significant atrial dilation exists. LV = left ventricle, LAU = left auricle.
Many horses have clinically insignificant insufficiencies. When the insufficiency in horses results in ventricular and atrial chamber enlargement or atrial dilation without ventricular enlargement the prognosis is poor (32). Mild to moderate left atrial dilation without ventricular changes in the presence of regurgitation suggests a wary but less ominous prognosis in the horse (32). Atrial size in the horse is usually assessed from two-dimensional images. Four-chamber planes are used and an atrial size of greater than 13.5 cm at its widest point is considered abnormal (Figures 5.19, 5.20) (33).
Figure 5.19 The size of the mitral valve annulus in this left parasternal two-chamber view of the heart is larger than 13.5 cm implying left atrial enlargement in this horse. LV = left ventricle, LA = left atrium.

Figure 5.20 The left atrium is a horse is measured from four-chamber views at the largest dimension parallel to the mitral annulus. RV = right ventricle, VS = ventricular septum, LV = left ventricle, LVW = left ventricular wall, LA = left atrium, RA = right atrium.
Mild left atrial enlargement may be seen in dogs with early mitral insufficiency before there is any measurable ventricular dilation. As discussed in Chapter 4, enlargement may not be apparent on the M-mode image and two-dimensional images should be used in various planes in order to determine if enlargement is present. Echocardiographic evidence of mild left atrial dilation may be more accurate than radiographic assessment because of the objective versus subjective measuring involved (34). The left atrial to aortic root ratio is used to evaluate atrial size (35,36). As the severity of mitral insufficiency increases however this ratio may not accurately reflect increases in atrial size. Aortic root size may decrease with reduced forward flow. This decrease in aortic root size is also seen in low circulating blood volume (34,37).
Severe left atrial enlargement and concurrent high left atrial pressures in dogs with mitral valvular

disease can on rare occasions result in rupture of the left atrial wall (38,39). The tear may occur within the atrial septum creating an atrial septal defect or it may tear in the lateral wall of the atrium or auricular appendage resulting in fluid accumulation within the pericardial sac (40). Echocardiographic evidence of fluid accumulation within the sac will be seen (39,41). Pericardial effusion occurs secondary to congestive heart failure, but the presence of a thrombus within the pericardial space confirms the diagnosis of atrial splitting since pericardial effusions secondary to neoplasia, pericarditis, or heart failure do not tend to form clots (Figure 5.21) (38). Thrombus within the pericardial space develops linear layers of hyperechoic material that conforms to the shape of the heart (Figures 5.22, 5.23) (39,42). Tumors within the pericardial sac are generally more rounded and not laminar in appearance.
Thrombus in the pericardial sac manifests itself in linear echoic layers that conform to the shape of the sac. Round or oval soft tissue shapes are usually tumors.
Figure 5.21 An echo-free space below the left ventricular wall in this parasternal four-chamber view representative of pericardial effusion is seen in this dog with congestive heart failure. Notice that the pericardial fluid is not seen at the heart base and stops just beyond the atrial and ventricular junction. RV = right ventricle, RA = right atrium, LV = left ventricle, LA = left atrium, PE = pericardial effusion.
Figure 5.22 Thrombus within the pericardial sac appears as long laminar strands (arrow). LV = left ventricle, RV = right ventricle, RA = right atrium, LA = left atrium, PE = pericardial effusion.

Figure 5.23 Thrombus in the pericardial sac usually forms long fibrinous strands or a layer (arrows) that conforms to the shape of the heart and sac. PE = pericardial effusion, LV = left ventricle.
Mitral valve motion may reflect elevated left ventricular diastolic pressures. Closure of the mitral valve is delayed after atrial contraction, and a B bump or shoulder is described in animals and man (Figures 4.99, 5.24) (43,44). This motion is reported to occur in animals where left ventricular diastolic pressures exceed 30 mm Hg (45).
Figure 5.24 Significantly, elevated left ventricular diastolic pressure may delay mitral valve closure, and a “B” bump is seen (arrow). RV = right ventricle, LV = left ventricle.

Motion of the interventricular septum and free wall are exaggerated in animals with mitral valve insufficiency, volume overload, and preserved myocardial function. This is secondary to the increased volume flowing into and out of the left ventricular chamber relative to the volume filling the right ventricular chamber (46,47). Septal motion may be greater than free wall motion since it is affected to a greater degree by volume changes in the right and left ventricles (Figure 5.25).
Figure 5.25 Motion of the interventricular septum and free wall is exaggerated in this dog (A) and this horse (B) with left ventricular volume overload and preserved myocardial function. (C) Septal motion is often greater than free wall motion with volume overload and preserved function since it is affected to a greater degree by volume and pressure relationships between the right and left ventricles. RV = right ventricle, LV = left ventricle, VS = ventricular septum, LVW = left ventricular wall.

Aortic valve motion may be abnormal in animals with significant mitral regurgitation. Blood will

flow into the lower pressure left atrium instead of the higher pressure systemic circulation as systole progresses and gradual closure of the aortic valves is seen. A triangular-shaped aortic valve is seen on M-mode images as opposed to a rectangular shape during systole (Figure 4.96) (48).
2D and M-mode Features of Mitral Insufficiency
Degenerative valvular lesions
LV and LA dilation
Exaggerated IVS and LVW motion
Possible delayed MV closure
Possible gradual AV closure
Left Ventricular Function
Fractional shortening (FS) as a measure of myocardial function in dogs with chronic degenerative mitral valve insufficiency should be elevated because of the presence of increased preload, decreased afterload, and generally increased contractile properties (Figure 5.26) (8,49). These were discussed in Chapter 4. There is no correlation between the stage of heart failure based upon American Heart Association criteria and the fractional shortening. Congestive heart failure in dogs with chronic mitral insufficiency is secondary to severe regurgitation and volume overload of the left atrium and ventricle, not myocardial failure in most cases (Figure 5.26) (49,50). Myocardial failure is thought to be a late and end stage consequence of chronic degenerative mitral valve disease and insufficiency in dogs (17,51,52).
Normal myocardial contractility results in a normal LV systolic chamber size no matter how dilated the LV becomes.
Figure 5.26 (A) Fractional shortening is elevated and systolic dimensions are normal when myocardial function is preserved in volume-overloaded hearts.(B) Although myocardial function is good in this volume-overloaded heart with mitral insufficiency, a small pericardial effusion seen below the left ventricular wall (arrow) is evidence of congestive heart failure. RV = right ventricle, LV = left ventricle.

Studies show that using fractional shortening and systolic dimensions or systolic index in dogs can separate dogs with abnormal myocardial function from those with normal myocardial function (49,52,53). Therefore, while fractional shortening is dependent upon preload, afterload, and contractility, systolic dimensions and systolic index are not affected by preload (54). Hearts with normal myocardial contractility will shorten to normal systolic dimensions regardless of how dilated the heart becomes (49,55). Only when the intrinsic contractility of the myocardium starts to fail will systolic dimensions become larger than normal (Figures 4.56, 4.57, 5.27). Using this as an indicator, Kittleson found that dogs have a normal systolic index of less than 30 ml/m2. Dogs with an index of greater than 100 ml/m2 had severe myocardial failure, dogs with a systolic index ranging from 52 ± 6 ml/m2 have mild myocardial impairment, and dogs between these two ranges with a mean of 73 ml/m2 have moderately reduced myocardial contractility. Systolic index is calculated by dividing the end-systolic volume by body surface area. The volume equation used in this study was Teichholz (49). One study suggested that a left ventricular systolic index of greater than 30 ml/m2 is associated with a poor survival time (23).

Assessment of Function with MR
Normal myocardial function
Systolic index <30 ml/m2
Severe myocardial failure
Systolic index >100 ml/m2
Moderate myocardial failure
Systolic index 70–100 ml/m2
Mild myocardial failure
Systolic index 34–70 ml/m2
Figure 5.27 (A) As myocardial failure develops, fractional shortening will fall within the normal range as opposed to being elevated, and systolic dimensions will become larger than normal. The fractional shortening in this left ventricle is just at the high end of normal. Notice that wall and septal motion are still excessive. (B) This dog with mitral insufficiency and left ventricular volume overload has a fractional shortening of approximately 26%, which is below the normal range. Systolic dimensions are also increased in this animal. Both of these imply severely impaired myocardial function. LV = left ventricle, RV = right ventricle.

There are conflicting data regarding the presence of myocardial failure in dogs with chronic degenerative mitral valve disease. Large breed dogs tend to develop myocardial failure secondary to chronic mitral valve disease more often than small breed dogs (9,17,51,54,56). Normal small and large breed dogs seem to have different systolic volume indexes, therefore, it may be more accurate to assess myocardial function by calculating a ratio of systolic dimension compared to expected systolic dimension for the body weight (54). Dogs were diagnosed with myocardial failure if the end systolic dimension to end systolic dimension expected ratio was greater than normal (1.13 ± .15 in large breed dogs, and .89 ± .21 in small breed dogs) (54). The expected end systolic dimension is based upon allometric ratios and calculated by using Equation 5.1 where ESDe is end systolic expected dimension and BW is body weight (57).
Equation 5.1 
See Chapter 4 for more information regarding these ratios.
Allometric ratios show a difference in percent change in area of the left ventricular chamber during contraction between normal dogs and dogs with degenerative mitral valve disease. A weighted change
in area of 2.1 or greater differentiated the normal dogs from those with degenerative valve disease. This is not necessarily that useful, but a further application of these allometric ratios showed the ability to differentiate dogs with mitral regurgitation that were not in left-sided congestive heart failure from those that were. This may have the potential to become a predictive variable for the development of congestive heart failure. A weighted left atrial dimension was 76% sensitive and 81% specific at differentiating the two groups with a weighted left atrial size of 1.55 or greater (58). In order to weight these variables, they are compared to the M-mode-derived aortic dimension. The aorta is normalized to the animal’s weight by using Equation 5.2:
Equation 5.2 
where W = the dog’s weight in kg. The measured M-mode numbers are then divided by the weighted aortic value (58,59).
Weighted Left Atrial Size
≥1.55 = predictive for development of CHF
Lack of adequate hypertrophy is one factor that causes diminished myocardial function in dogs with left ventricular volume overload secondary to chronic mitral valve disease. High afterload and increased wall stress is the stimulus for hypertrophy, and volume overload may not provide an adequate stimulus for good compensatory hypertrophy as the heart dilates to make up for the valvular regurgitation. The normal response to increased afterload is hypertrophy. This normalizes wall stress. Wall stress is determined by the ratio of radius to wall thickness as seen in Equation 5.3.
Equation 5.3 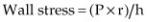
Where h = wall thickness, r = radius, and P = systolic blood pressure. An increase in this ratio results in high wall stress and a decrease results in low wall stress. The eccentric hypertrophy pattern seen with mitral insufficiency has a normal to high wall stress value since hypertrophy is usually limited. During left ventricular contraction, there is movement of blood into the low pressure left atrial chamber. This decreases the impetus for the development of hypertrophy to compensate for the volume overload of mitral regurgitation. The thin walls however are very compliant and allow for enhanced ventricular filling and increased stroke volume to compensate for the regurgitant volume. Still, hearts with mitral regurgitation have the lowest mass-to-volume ratio, even less than hearts with aortic regurgitation. When systolic function is reduced in hearts with left ventricular volume overload secondary to mitral insufficiency, wall stress is very high because of this low wall-to-chamber radius ratio. This is thought to contribute to progressive left ventricular systolic failure (60).
Increased wall stress because of low wall thickness to chamber size ratio is thought to contribute to progressive LV systolic failure.
Measurement of wall thickness to chamber size is a way to evaluate the degree of compensatory hypertrophy (61,62). The diastolic dimension of the left ventricular chamber is divided in half to provide a radius measurement and the wall thickness (h) to chamber radius (r) is calculated. A normal wall thickness to chamber radius is .47 ± .11 in large breed dogs (>20 kg) and .53 ± .11 in small breed dogs (<15 kg) (54).
Wall thickness/chamber size (h/r)
Dogs <15 kg: .53 ± .11
Dogs >20 kg: .47 ± .11
Fractional shortening is also used to divide dogs with chronic mitral valve insufficiency into various categories of impaired contractility (49). Dogs with any degree of mitral insufficiency from mild to severe whether they are in congestive heart failure or not will have fractional shortenings above the normal range if they have no myocardial dysfunction. Dogs with mild to moderately impaired myocardial contractility will have FS within the normal range of 33–45%. Severe myocardial failure is present when FS is below the normal range (Figure 5.27).
Mitral annular motion (MAM) taken from M-mode recordings of the mitral annulus on left apical four-chamber views becomes depressed if there is myocardial failure. This is not depressed in most dogs with chronic degenerative mitral valve disease but is depressed in dogs with cardiomyopathy (Figure 5.28). Mitral annular motion measures longitudinal shortening of the left ventricular chamber and may be different from circumferential fiber shortening, which is what is measured for fractional shortening. This may help differentiate normal from abnormal systolic function in some equivocal cases (63).
Figure 5.28 Mitral annular motion (arrow) is depressed when there is systolic failure, but is usually normal in hearts with degenerative valve disease.
Color-Flow Doppler Evaluation
Color-flow Doppler readily finds and identifies regurgitant flows. Using this modality and paying attention to the jet area with respect to the receiving chamber, the area of flow convergence, and the jet width at its origin significantly improves the evaluation of severity of the regurgitation (1).
Color-flow analysis of regurgitation uses:
Jet area
Flow convergence
Vena contracta

Jet Size
Pathological regurgitation can be semiquantitatively assessed by measuring the size of the color-flow jet within the atria in the case of AV valvular insufficiency or within the outflow tract or ventricle in the case of aortic or pulmonic insufficiency (1,14,31,64–69). In man, mitral or tricuspid insufficiency jets that occupy less than 20% of the atrium are mild insufficiency (Figures 5.29, 5.30, 5.31). A jet that occupies 20 to 40% of the atrial area represents moderate insufficiency, and when greater than 50% of the atrium is filled by the aliased flow of regurgitation, it is classified as severe insufficiency (Figures 5.13, 5.32, 5.33, 5.34, 5.35). This method uses the largest regurgitant jet found in any plane (65,70). Studies that average the jet size over several imaging planes do not show any significant improvement in predicting severity (71).
Figure 5.29 The color flow jet of mitral insufficiency in this horse involves less than 20% of the left atrial chamber and is consistent with mild mitral regurgitation. View = left parasternal two chamber, LV = left ventricle, LA = left atrium.
Figure 5.30 Two small jets of mitral insufficiency are seen in this heart with mild mitral insufficiency. LV = left ventricle, LA = left atrium, View = right parasternal four chamber.

Figure 5.31 Mild mitral insufficiency is seen in this horse with an eccentric color flow jet that fills less than 20% of the atrial chamber. View = left parasternal two chamber, LV = left ventricle, LA = left atrium.
Figure 5.32 The color flow jet of mitral insufficiency in the left atrium of this dog with dilated cardiomyopathy involves between 20 and 50% of the left atrial area consistent with a moderate amount of regurgitation. LV = left ventricle, LA = left atrium, RA = right atrium, View = right parasternal four chamber.

Figure 5.33 The color flow jet of mitral insufficiency fills up more than half of the left atrial chamber and implies severe mitral insufficiency in this dog with degenerative valvular disease. LV = left ventricle, LA = left atrium, View = right parasternal four chamber.
Figure 5.34 A color flow regurgitant jet that fills greater than 50% of the left atrial chamber is indicative of severe mitral insufficiency. RV = right ventricle, RA = right atrium, LV = left ventricle, LA = left atrium, View = right parasternal four chamber.

Figure 5.35 The mitral regurgitant jet (arrow) on this apical four-chamber view fills approximately 50% of the left atrial chamber making it a moderately severe mitral insufficiency. LV = left ventricle, RV = right ventricle, LA = left atrium, RA = right atrium.
Assessment of mitral insufficiency based upon color jet area is the poorest of color-flow assessment methods because of the technical factors mentioned previously (gain, PRF, frame rate, etc.) as well as for the following situations (1,72). When the systemic pressures driving the regurgitant jet are abnormal, these percentages are no longer accurate. The driving pressure affects the velocity of the color-flow jet and the area that it encompasses. One in vitro study showed that an equal volume of regurgitant blood displayed varying sizes of color-flow jets based upon the pressure driving the regurgitant jet (1,73,74). Low systemic pressure and high left atrial pressure can show small jet areas despite having severe regurgitation, and high systemic pressure can cause a regurgitant jet to be quite large despite having mild insufficiency (1).

Abnormal systemic pressure (low or high) makes jet area assessment of MR inaccurate.
Heart rate also affects regurgitant jet size. Fast heart rates tend to result in underestimation of the degree of insufficiency when assessed with color-flow Doppler (75).
Eccentric regurgitant jets limit the accuracy of using jet area for classification of severity. An eccentric jet, which is commonly seen in the presence of mitral valve prolapse, causes the jet to hug the atrial walls. This prevents the jet from dispersing into the atrial chamber, turbulence is no longer as apparent, which results in underestimation of regurgitant severity. This is called a Coanda effect (Figure 5.36) (1,76–79). When the regurgitant jet is centrally directed and there is a normal sinus rhythm, then the assessment of severity using color-flow Doppler is usually reliable (74,78).
Underestimation of jet size occurs with:
Rapid heart rates
Eccentric jets (Coanda)
Figure 5.36 When regurgitant jets flow along the atrial wall (coanda), the turbulence is damped by the wall and the severity of the insufficiency may be underestimated. (A) The jet of mitral insufficiency in this dog flows along the left atrial wall and then up along the back wall (arrows). (B) This thin jet of mitral regurgitation is difficult to assess because of the coanda effect (arrows). (C) This mitral regurgitant jet wraps along the lateral wall of the left atrium on this apical view. RV = right ventricle, VS = ventricular septum, LV = left ventricle, LVW = left ventricular wall, LA = left atrium, RA = right atrium, AO = aorta.

Other methods that attempt to overcome some of these limitations have been investigated. Muzzi et al. calculated a mitral regurgitant jet area to left trial area in apical four-chamber imaging planes in

dogs. A ratio of <30% represents mild regurgitation, 30 to 70% represents moderate regurgitation, and >70% of the left atrial area occupied by the regurgitant jet correlated with severe mitral regurgitation based upon comparison to other Doppler-derived calculations of regurgitant fractions and volumes as well as effective regurgitant orifice area (Figure 5.37) (13,70). The correlation between regurgitant fraction and the area of the regurgitant jet measured from color Doppler was weak (r = .59), but correlation between regurgitant fraction and left atrial area was strong (r = .88). Regurgitant volume also correlated well with regurgitant jet area (r = .81) (70). There are statistically significant differences in regurgitant volume, regurgitant fraction, regurgitant jet area, regurgitant jet area to left atrial area ratio, and effective regurgitant orifice size between dogs in the three classifications of heart failure (14,70). When ruptured, chordae tendineae are a factor in the degree of regurgitation, however the severity of regurgitation assessed by color-flow jet area to left atrial area did not correlate with class of heart failure and clinical signs. Dogs with no clinical signs sometimes had evidence of severe mitral regurgitation. There may be different clinical consequences when primary, secondary, or tertiary chordae rupture (13). Evaluation of the ratio of regurgitant jet area to left atrial size is a reproducible measurement with little variation (<10%) and good repeatability (80). Jet area can also be assessed by spectral Doppler if the time is taken to place a PW gate at various points in the atrium in order to assess the extent of the jet (64,67).
Ratio of MR jet area to LA area:
<30% = mild MR
30%–70% = moderate MR
>70% = severe MR
Regurgitant jet area correlates well with regurgitant volume.
Left atrial area correlates well with regurgitant fraction.
If MR was secondary to ruptured chordae tendinaea, these were not accurate.
Figure 5.37 Tracing the area of the mitral regurgitant jet and comparing it to left atrial area is a less subjective way to assess severity based upon area. RV = right ventricle, VS = ventricular septum, LV = left ventricle, LVW = left ventricular wall, LA = left atrium, AO = aorta.

Concern over the effects of gain, pulse repetition frequency, size of the dog, and heart rate on the assessment of color-flow evaluation of severity of regurgitation has led to studies that utilize other methods of assessing color-flow regurgitant jets. One study in dogs uses ratios of regurgitant to forward flow (68). Frames displaying the largest color-flow areas are used. Regurgitant jets are traced and a mitral regurgitant jet mapping area was determined (MRMA) as well as the color-flow area representing aortic forward flow (AFMA). The ratio of these two areas (MRMA/AFMA) correlated well to the New York Heart Association classification of heart failure. Stage 1 of heart failure with no clinical signs had an average ratio of .501 with a range of .273 to .875. Stage 2 had an average ratio of
.779 with a range of .441 to 1.117. Stage 3’s average value was 2.183 and ranged from 1.586 to 2.793 while stage 4 had an average ratio of 4.449 and a range of 4.025–4.873. This method may eliminate machine and user variation. Additionally it may help stage heart failure more appropriately by helping to differentiate the clinical signs of heart failure from other causes such as exercise intolerance due to aging and joint disease (68).
Color-flow Doppler assessment of mitral insufficiency in horses is often limited by the size and depth of the left atrium. Many times spectral Doppler can document the regurgitant jet but color-flow Doppler cannot provide information on the extent of the leak (33). The best Doppler information in horses is usually found on left parasternal twoor four-chamber views where the left side of the heart is closer to the transducer (Figure 5.31).
Proximal Isovelocity Surface Area
Proximal isovelocity surface area (PISA) is an area of flow acceleration and convergence proximal to the mitral valve as the regurgitant jet approaches the regurgitant orifice. This method assumes that flow accelerates as it approaches the small orifice and that it does so in concentric hemispheres on the ventricular side of the valve (76,81,82). The more blood volume that moves backward through the valve the larger the proximal hemisphere is. Studies have shown that this measurement can be used to determine not only the regurgitant orifice area but also regurgitant fraction and volume when used in conjunction with regurgitant flow velocity (1,31).
PISA
Use apical four-chamber view.
Use centrally directed MR jet.
See flow convergence, vena contracta, and jet expansion.
Nyquist limit should be 50–70 cm/sec.
Use largest MR jet during midsystole.
Use zoom.
Adjust baseline in direction of regurgitation until perfect hemisphere is seen.
Nyquist limit should now be 18–40 cm/sec.
In order to record and measure the proximal isovelocity hemisphere, the mitral regurgitant jet is identified on an apical four-chamber view. The proximal flow convergence, the vena contracta and the regurgitant jet should all be visualized and the Nyquist limit should be set somewhere between 50 and 70 cm/sec (Figure 5.38). The lack of a flow convergence area is consistent with minimal to mild regurgitation while the presence of a large flow convergence area is consistent with a significant regurgitant volume (Figure 5.39) (1). The largest regurgitant jet during peak to mid-systole should be isolated on frame-by-frame images. Zooming in on the mitral valve at the location of flow convergence will optimize measurement accuracy. The baseline of the color map should be moved
downward in the direction of regurgitation until the flow convergence area has a hemisphere of solid color outlined in the aliased signal. The Nyquist limit (Va in cm/sec) should be somewhere between 18 and 40 cm/sec when this hemisphere is seen.
Figure 5.38 Significant mitral regurgitation always has an area of proximal flow convergence (PISA) (arrow). RV = right ventricle, VS = ventricular septum, LV = left ventricle, RA = right atrium, MR = mitral regurgitation.
Figure 5.39 Mild mitral regurgitation will have no flow convergence (PISA). RV = right ventricle, VS = ventricular septum, LV = left ventricle, LVW = left ventricular wall, LA = left atrium, RA = right atrium.
The Nyquist limit at which the radius is measured is not the most important factor; the important feature is that the flow convergence area is as close to a perfect hemisphere as possible (1,83,84). The following factors should be recorded and measured: radius of the hemisphere of the proximal flow convergence (r in cm), the peak mitral regurgitant velocity (MRvmax in cm/sec) and its velocity time

integral (MRVTI in cm) (Figure 5.40). Flow rate, effective regurgitant orifice area (EROA) and regurgitant volume (RV) are calculated as follows in equations 5.4 to 5.6 (1,76,81,82,85).
Equation 5.4 
Equation 5.5 
Equation 5.6 
Figure 5.40 Zoom in on the PISA and measure its radius (black arrow). The Nyquist limit (white arrow) is .16 m/sec. MR Rad = mitral regurgitation PISA radius, MR Als Vel = mitral regurgitation aliased velocity, MR Flow = mitral regurgitation flow rate.
Notice that the EROA in the regurgitant volume equation is in cm2; remember to convert the MRvmax to cm/sec if your machine calculates it in m/sec, and if your equipment reports EROA in mm2, remember to change it to cm2 if you are calculating regurgitant volume manually. Effective regurgitant orifice areas of <.2 cm2 reflect mild insufficiency; an orifice area of between .2 cm2 and
.39 cm2 implies a moderate amount of regurgitation and an EROA of ≥.4 cm2 is consistent with a severe mitral regurgitation (1).
PISA—EROA (man)
<.2 cm2 = mild MR
.2 cm2–.39 cm2 = moderate MR
.4 cm2 = severe MR
The PISA method requires an elliptical hemisphere and excellent alignment with a centrally directed regurgitant jet. Misalignment with an eccentric jet will underestimate flow velocity and overestimate orifice areas (1). Hemicircles measured too close to the mitral orifice are generally too flat, which will underestimate flow rates, while flow convergence hemispheres too far away typically maintain too much of a parabolic shape and will overestimate flow rates (Figures 5.41, 5.42) (1). Try to optimize the flow convergent hemisphere to be as close to a half circle as possible. Studies have shown good

correlation with actual flow rates when flow convergence is recorded and measured accurately (r =
.96) (1,31,84,86). Three-dimensional imaging with color-flow Doppler has shown that the area of flow convergence varies based upon imaging plane and three-dimensional reconstruction improves accuracy immensely (31,87). Jet direction and flow convergence shape are affected by orifice shape and valve structure (76).
Figure 5.41 Flat PISA hemispheres (arrow) underestimate flow rates. RV = right ventricle, LV = left ventricle, RA = right atrium.
Figure 5.42 Peaked PISA hemispheres (arrow) overestimate flow rates. LV = left ventricle, LA = left atrium, AO = aorta.
There is much day-to-day variability in regurgitant fraction calculated via the PISA method in dogs ( 8–11% (88) to 20%) (89). The effective regurgitant orifice area (EROA) however has shown a much lesser degree of variability ( 15%) (88,89). Studies in man have shown that increased severity of mitral regurgitation based upon regurgitant fraction (>50%) or EROA (>40 mm2)is correlated with

poorer outcomes regardless of the class of heart failure these individuals are in at the time of the evaluation (1,90). It has been suggested that further study may determine whether calculation of these parameters in asymptomatic dogs with large regurgitant fractions or EROA can be predictive of the course of clinical signs or in determining when to initiate medical therapy (88).
Kittleson et al. showed that by using the PISA method to calculate regurgitant fraction, dogs with severe mitral regurgitation had more than 75% of their left ventricular volume move backward into the left atrial chamber during systole. Dogs with moderate mitral insufficiency had 45 to 75% regurgitant fractions, and dogs with mild insufficiency had regurgitant fractions of less than 45% (31). Using just centrally directed jets, one study in dogs showed excellent repeatability with variation between 8 and 11% in mitral regurgitant fraction using the PISA method. This study also showed that with severe mitral regurgitation, using the regurgitant jet area often resulted in a jet area or left atrial area of 1:1. This makes differentiating between dogs with moderate or severe mitral regurgitation or trying to subclassify within the severe group, difficult if not impossible (85).
PISA—Regurgitant Fraction (dogs)
75% RF = severe MR
45%–75% = moderate MR
<45% = mild MR
PISA measures instantaneous flow rate of the regurgitant jet, which means that it is a measure of the largest EROA during the regurgitant time period (1). PISA also assumes holosystolic regurgitant flow. This method is not accurate when the insufficiency encompasses only a portion of the systolic time period. Using color M-mode can define the duration of regurgitation (1).
PISA measures the largest EROA.
Vena Contracta
Measuring the proximal regurgitant jet height as it enters the left atrium through the mitral valve has also been studied in an effort to eliminate the other limitations of color-flow evaluation. The smallest regurgitant color-flow jet, the vena contracta, at the mitral regurgitant orifice is identified by carefully angling the sound beam in various directions. Long-axis parasternal images, or imaging planes that identify the vena contracta perpendicular to the sound plane, are recommended as it minimizes error arising from poor lateral resolution (Figure 5.43). Views that orient the vena contracta parallel to the sound beams should not be used (1). Small color sectors also provide the best lateral and temporal resolution (1). Identify the proximal flow convergence, the vena contracta, and the jet expansion into the left ventricular chamber. Then zoom in on the vena contracta to minimize measurement error (Figure 5.44).
Vena Contracta
Use parasternal long-axis views.
See flow convergence, and vena contracta and jet expansion.
Zoom in.
Measure smallest regurgitant jet width through the valve.
Calculates the smallest EROA.

Figure 5.43 The vena contracta is the smallest jet height moving through the regurgitant orifice (arrows). The vena contracta is 2.02 mm in this dog. RV = right ventricle, VS = ventricular septum, LV = left ventricle, LVW = left ventricular wall, LA = left atrium, RA = right atrium.
Figure 5.44 Zoom in on the vena contracta (arrows) for accurate measurements. The vena contracta is 2.38 mm in this dog. LV = left ventricle, LVW = left ventricular wall, LA = left atrium.
The vena contracta is not affected by driving pressure or flow rate in fixed orifices (91). In man, studies have shown that the vena contracta correlates better with regurgitant severity than jet area when compared to invasive measurement methods (76,92,93). The width of the vena contracta has a
.85 correlation coefficient to angiographic data. Mild regurgitation in man corresponds to a vena contracta of less than .3 cm, while severe insufficiency has widths greater than .6 to .8 cm (92,94,95). There is considerable overlap in the midrange, and other methods of evaluation should also be used to confirm the assessment of severity (1). It remains to be seen whether this is applicable in dogs.
Applying the area equation to the vena contracta width provides another measure of EROA. This

measurement defines the orifice at its smallest if done correctly (1). Summating the vena contracta in patients with multiple regurgitant jets is not accurate, but summating their areas is (92).
Vena Contracta (man)
<3 mm = mild >6 mm = severe
Much overlap in between
Spectral Doppler Evaluation
Jet Area
Spectral Doppler can map the regurgitant jet area and severity of mitral insufficiency. Careful placement of the pulsed-wave Doppler gate at various depths within the left atrium can provide information on how wide and deep the regurgitant jet extends into the left atrium. An aliased signal is seen at any point where the gate detects a regurgitant jet (Figure 5.45). Increasing depth and width implies more severe regurgitation, and assessment is the same as with color-flow signals. This is a time-consuming method, and it may not be possible to interrogate the entire left atrium in some unhappy patients.
Figure 5.45 Interrogating the left atrial chamber with a pulsed wave gate can identify the extent of the mitral insufficiency jet with an aliased signal. The severity can be determined by how much of the atrium contains an aliased signal.
Regurgitant Volume and Fraction
Chapter 4 described how to measure stroke volumes and cardiac output. Regurgitant volume is calculated by subtracting forward stroke volume through the aortic valve from total left ventricular volume moving through the mitral valve into the left ventricular chamber (Equation 5.7). Regurgitant fraction is the percent of total stroke volume that flows back into the left atrial chamber (Equation 5.8). Aortic area is calculated by determining the cross-sectional area of the aorta at the level of valve

insertion from a long-axis parasternal imaging plane or by tracing the aortic area on transverse views (Equation 5.9, Figure 4.63). This area is multiplied by the flow velocity integral of aortic flow taken from the apical five-chamber image with the PW gate placed at the level of the valve to obtain forward stroke volume (Equation 5.10). Total stroke volume through the mitral valve is obtained by multiplying the flow velocity integral of transmitral flow taken at the level of the mitral annulus on an apical four-chamber imaging plane by the diameter of the mitral annulus on this same imaging plane (Figures 4.62, 4.66) (Equations 5.11, 5.12) (70,96). Effective regurgitant orifice area is calculated by multiplying the regurgitant fraction by the flow velocity integral of the mitral regurgitant jet (Equation 5.13) (1,70,96). Regurgitant fractions calculated this way have a significant correlation with left atrial size (r = .88) (70).
Equation 5.7 
Equation 5.8 
Equation 5.9 
Equation 5.10 
Equation 5.11 
Equation 5.12 
Equation 5.13 
Where r is measured in cm.
There are some limitations that affect the accuracy and assessment of calculating regurgitant fraction this way. Errors in annular diameter measurements are compounded when inserted into the area calculation (r2). The valve used for normal stroke volume must not be insufficient. Mitral annular area measurements also assume a circular-shaped annulus, which is not always the case. Finally, information may be conflicting. For example, severe regurgitation with minimal left ventricular dilation may have a small calculated regurgitant volume but a high regurgitant fraction and EROA (1). This method of calculating the severity of mitral regurgitation is useful however when there are multiple or eccentric jets (1).
Calculating total stroke volume by using two-dimensional measurements of diastolic and systolic volumes overcomes this problem. Using Simpson’s rule (method of disks) to calculate end diastolic and end systolic volumes from apical four-chamber imaging planes allows calculation of total stroke volume as well (Figure 4.59). This can then be substituted into the RV and RF equations (76). Foreshortened apical views limit the accuracy of this method. Refer to Chapter 4 for more information regarding volume calculations.
Transmitral Valve Flow
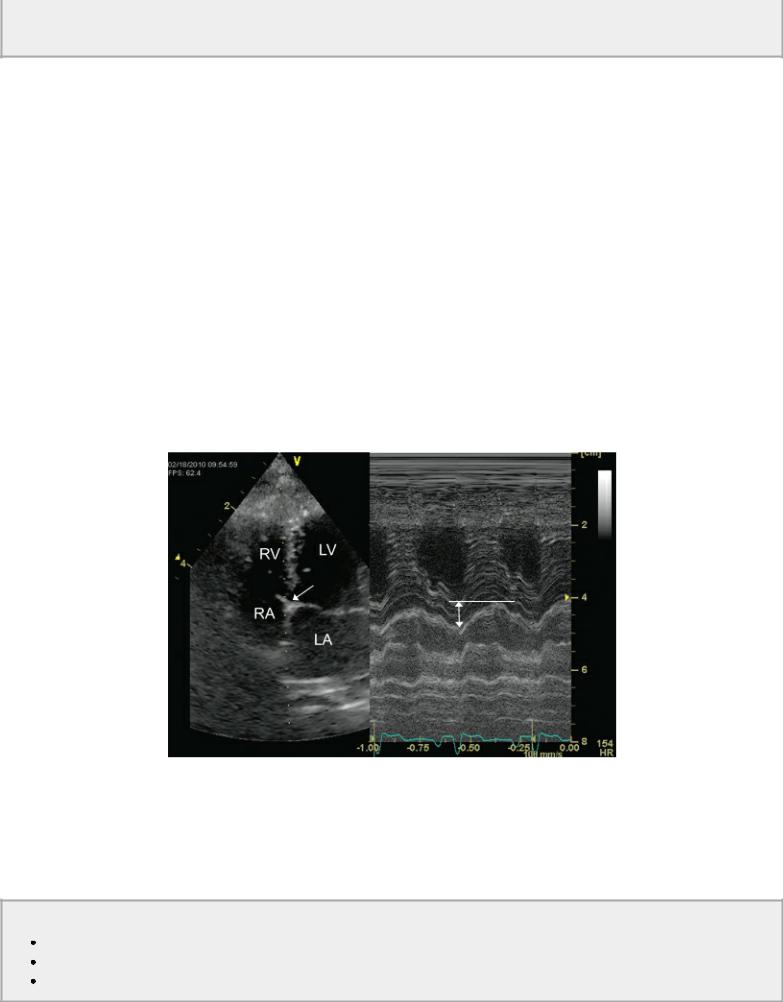
Transmitral flow velocity greater than 1.2 m/sec is predictive of poor survival time. Transmitral flow velocity is affected by both left atrial pressure and left ventricular filling pressure, and by volume flowing through the valve during diastole (1,76,97). All of these are elevated in dogs and man with significant mitral valvular insufficiency (Figure 5.46) (1,23,97).
Transmitral E flow velocity >1.2 m/sec = significant regurgitation.
Figure 5.46 Increased transmitral valve flow velocity, 1.63 m/sec, in this dog, is a reflection of left atrial pressure, left ventricular filling pressure, and regurgitant volume.
Relationships between transmitral E velocity and IVRT and mean left atrial pressure (r = .73) and between E:Ea and mean left atrial pressure (r = .83) have been reported (98,99). The calculation of mean left atrial pressure (MLAP) from E:Ea is shown in Equation 5.14.
Equation 5.14 
where MLAP is mm Hg, E is measured in m/sec, and Ea is measured in m/sec. This study in dogs involved experimentally induced acute mitral regurgitation. When fused E and A waves are found on spectral or tissue Doppler studies, the fused peak is treated as the peak E or E′ (Figure 5.47). There is a wide confidence interval for each E:Ea and the predicted MLAP, but an E:Ea of less than 6 predicts a MLAP under 20 mm Hg and E:Ea values greater than 9 predict a MLAP greater than 20 mm Hg (98). Valid application of E:Ea in the clinical setting with chronic mitral regurgitation remains to be studied.
Figure 5.47 E:Ea ratios are used to predict mean left atrial pressure. (A) Here E = 1.36 m/sec and (B) E′ = .12 m/sec yielding a ratio of 11.33. See text for predicted left atrial pressure.

Using transmitral peak E velocity and isovolumic relaxation time in a regression equation also correlates (r = .7) with left ventricular end diastolic pressure, Equation 5.15, where peak E is in cm/sec and IVRT is in msec (Figure 5.48). This study used experimentally induced changes in preload. Its application in chronic mitral regurgitation also needs to be validated (99).
Equation 5.15 
Figure 5.48 (A) Transmitral valve E velocity and (B) isovolumic relaxation time are used in a regression equation that predicts mean left atrial pressure. See text for the equation and details.

Rapid mitral valve deceleration time has been correlated with poor prognosis in people and in dogs (<80 msec) with dilated cardiomyopathy. This parameter has been studied in man with various underlying cardiac disease resulting in congestive heart failure including mitral valve disease and a substantial correlation between deceleration time and ventricular stiffness has been found (100). Impaired diastolic function is an important factor in many people with cardiac disease and may be so in animals as well (100). This restrictive filling pattern is the result of increased left ventricular volume and concurrent impaired compliance, which causes rapid increases in left ventricular pressure for a small change in volume, and as a result left ventricular filling is abruptly decreased, shortening the deceleration time (101). Its application in dogs with degenerative mitral valve disease needs further study.
Regurgitant Jet Appearance
The velocity of a mitral regurgitant jet does not provide any information regarding severity of the insufficiency, but the flow profiles and density of the signal do yield some useful information (1). Regurgitant jet flow profiles provide some indication regarding the hemodynamic significance of the insufficient volume and left atrial pressures. Mitral regurgitant jet appearance is usually symmetrical (Figure 5.49). A cutoff flow profile, a v wave, on the deceleration side of the flow profile suggests a
rapid increase in left atrial pressures secondary to the regurgitant volume (Figures 5.49) (1,76,102,103). The result of this rapidly elevated atrial pressure is a decrease in regurgitant flow in mid to late systole. The flow profile is no longer symmetrical as would be seen in patients without high atrial pressures and compliant atrial chambers. This type of flow profile is often seen in acute severe mitral insufficiency.
Figure 5.49 (A) A typical flow profile of mitral regurgitation is symmetrical with peak velocity occurring about halfway through systole. Arrhythmia in this dog changes the peak velocity. (B) A cutoff in flow, a v wave, is seen on mitral regurgitant jets when left atrial pressures significantly elevate during systole (arrow).
The strength or density of the regurgitant flow profile represents the number of red blood cells within the regurgitant jet. A CW flow profile that is as dense as forward diastolic flow through the mitral valve represents a significant regurgitant volume (Figure 5.50). Flow profiles that are barely discernable or do not show complete envelopes suggest that the regurgitant volume is small (1). The flow should be recorded through a regurgitant jet that includes the flow convergence, vena contracta, and the jet expansion into the left atrium.

MR Jet Appearance
Presence of v wave
= High left atrial pressure
Density
Weak incomplete envelopes = mild MR
MR jet as dense as trans MV flow = severe MR
Figure 5.50 (A) Mitral regurgitant jets that are faint (arrow) suggest trivial to mild regurgitation. (B) Mitral regurgitation with flow profiles that are dense but not as dense (arrow) as transmitral valve flow are moderate in severity. (C) Mitral regurgitation is severe when forward and regurgitant flow densities (arrow) are equal.

Pulmonary Vein Flow
Spectral Doppler assessment of pulmonary venous flow also provides information regarding the

severity of mitral regurgitation. Significant regurgitation results in reduced pulmonary venous S wave velocity and with severe regurgitation reversal of flow in the pulmonary veins during systole (76,104). Eccentric jets and decreased atrial compliance or elevated left atrial pressure may affect this flow profile too (Figure 5.51) (76,104).
Pulmonary Vein Flow
Systolic reversal = severe MR
Figure 5.51 Pulmonary vein systolic flow reversal (arrow) is a sign of severe mitral regurgitation.
Presence of Pulmonary Hypertension
Pulmonary hypertension is a common consequence of left-sided heart disease that increases left atrial pressure (105,106). Color-flow Doppler is used to align a tricuspid regurgitant jet with the spectral Doppler cursor. Pressure gradients obtained from tricuspid regurgitant jets are added to the right atrial pressure and provide an estimate of right ventricular pressure (105). Atrial pressure is estimated to be 5 mm Hg or less when there is no evidence of right atrial dilation and the vena cava collapse completely with respiration (Figure 5.52). The right atrium has an estimated pressure of approximately 10 mm Hg if there is right atrial dilation, no evidence of right-sided congestive heart failure, and the vena cava collapse approximately 50% with respiration. When the vena cava does not collapse with respiration and there is evidence of right-sided congestive heart failure, right atrial pressure is estimated at ≥15 mm Hg (13,80,106,107). Calculated systolic right ventricular pressure is equal to pulmonary artery systolic pressure in the absence of pulmonary stenosis. Pulmonary pressure of less than 50 mm Hg reflects mild pulmonary hypertension, pressure between 50 and 75 mm Hg reflects moderate pulmonary hypertension, and estimated pressure above 75 mm Hg is severe pulmonary hypertension (13,80,105,106). Refer to Chapter 6 for more information about pulmonary hypertension.
Vena Cava Respiratory Collapse and RA Pressure

Complete collapse with respiration = RA pressure <5 mm Hg
50% collapse with respiration = RA pressure 10 mm Hg
No collapse with respiration = RA pressure >15 mm Hg
Figure 5.52 The vena cava should collapse with every inspiration. (A) Image is of the vena cava as it crosses the diaphragm. (B) An M-mode cursor allows measurement of change in dimension with respiration. Here it is 35%, an indication that right atrial pressure is approximately 10–15 mm Hg.
Jets of pulmonary insufficiency may also be used to determine the presence of pulmonary hypertension. Flow velocity and pressure gradient from the insufficient jet reflect diastolic pulmonary artery pressure. The end diastolic peak velocity is used to calculate pulmonary artery diastolic pressure, and the initial peak velocity at the start of diastolic regurgitant flow reflects mean pulmonary artery diastolic pressure and is a good representation of pulmonary wedge pressure (Figure 4.89) (13,106). See Chapter 4 for more information regarding the calculation of pulmonary vascular pressure.
Pulmonary hypertension is a negative predictive factor for survival in man but was not an important

factor in the survival time of dogs with ruptured chordae tendinae (13,101). One study showed that 15% of dogs with degenerative mitral valve disease have pulmonary hypertension. Most of these dogs (70%) were in ISACHC class III stage of heart failure, but almost a third were in class Ia or Ib stage of heart failure (14,80). No dog with mild mitral regurgitation based upon color-flow Doppler had documented pulmonary hypertension. Another study in 53 dogs diagnosed with pulmonary hypertension showed 30% of them had chronic mitral valve disease as the underlying cause (105). When pulmonary hypertension was mild most dogs were asymptomatic for right-sided heart disease, and most did not have echocardiographically detectable changes in the right side of the heart that would suggest the presence of pulmonary hypertension (i.e., right ventricular hypertrophy, right atrial, or pulmonary artery dilation) (80). The left atrial to aortic root ratio (LA/AO) is significantly and positively correlated with both systolic and diastolic pulmonary artery pressure (80).
Left atrial to aortic root ratio correlates positively with systolic and diastolic pulmonary vascular pressure.
Acute Mitral Regurgitation
Acute mitral regurgitation is difficult to assess with color-flow Doppler. The temporal resolution of color flow is not adequate with rapid heart rates. Maximize frame rate in this situation. Small left atrial size, one that has not had the chance to chronically dilate, causes left atrial and left ventricular pressure to equilibrate rapidly, and color regurgitant jets do not develop well (75,108). Use PISA and vena contracta in these situations since they seem to remain reliable under these conditions. Systolic pulmonary venous flow reversal and the presence of mitral regurgitant jet v wave provide insight into the severity of the regurgitation when color-flow analysis is not adequate (1,75).
Diastolic Mitral Insufficiency
Diastolic mitral insufficiency is seen in animals with atrioventricular (AV) conduction abnormalities. It is seen with first, second, and third degree AV block as well as retrograde P waves. The regurgitation is typically seen during late diastole when the atrial contraction is not followed by an appropriate ventricular contraction, which normally closes the valve. The insufficiency is hemodynamically insignificant and should be differentiated from pathologic systolic leaking of the valve (109,110).
Overall Assessment of Mitral Regurgitation
A mitral regurgitation index has been devised in man that assigns a number from 0 (absent) to 3 (significant) for six different parameters used in the evaluation of mitral regurgitation in man. These parameters include PISA radius, jet expansion into the left atrium, vena contracta, pulmonary venous flow, pulmonary artery pressure, and left atrial size. The average of these scores is calculated (111). A score of <1.7 is consistent with mild regurgitation and is reliable in separating mild from severe mitral insufficiency. A score of 1.1 to 2.3 implies moderate regurgitation while a score of 1.7 to 3.0 is consistent with severe mitral regurgitation (111). These parameters and the grading system are listed in Table 5.1. With this system there is considerable overlap in the moderate to severe range, and it reinforces the need to use many parameters to assess the severity of mitral regurgitation.
Do not rely on a single method of assessment. Use multiple parameters to assess severity of MR.

Table 5.1
Mitral Regurgitation Index
Adapted from: Thomas L, Foster E, Hoffman J, et al. The mitral regurgitation index: an echocardiographic guide to severity. J Am Coll Cardiol 1999;33:2016–2022.
The Society of Echocardiography Task Force on the Assessment of Native Valvular Regurgitation in man recommends integrating several parameters to assess the severity of mitral regurgitation (1). This helps eliminate error in technique and measurement and helps define which parameters may be erroneous because of technical error, physiologic reasons, and chronicity of the disease process. The limitations of each method are listed in Table 5.2 (1). The committee has proposed several echocardiographic measurements that are more than 90% specific for the degree of regurgitation and several parameters that are supportive in evaluating the severity of mitral regurgitation. These are listed in Table 5.3 (1).
Table 5.2
Advantages and Limitations of Doppler Techniques for the Evaluation of Valvular Regurgitation
Technique |
Advantages |
Limitations |
|
|
|
|
|
Jet Area |
fast subjective assessment |
subject to technical error |
|
assess jet direction |
not accurate when there is the Coanda effect |
||
|
|||
|
|
|
|
|
straightforward |
cannot use with multiple jets |
|
Vena contracta |
small measurements = increased % of error |
||
differentiates mild from severe |
|||
|
moderate severity = not reliable |
||
|
|
||
|
|
|
|
|
flow convergence at 50–70 cm/sec = significant MR |
not accurate in eccentric jets or multiple jets |
|
PISA |
measure EROA |
||
measures largest EROA |
|||
|
measure RF and RV |
||
|
|
||
|
|
|
|
|
accurate with eccentric jets and multiple jets |
MV annulus measurement not always accurate |
|
PW flow assessment |
measure EROA |
||
cannot use aorta if AR present |
|||
|
measure RV and RF |
||
|
|
||
|
|
|
|
CW flow profile |
simple to obtain and assess |
not quantitative |
|
|
|
|
|
|
uncomplicated |
affected by LA pressure |
|
Max MV E velocity |
affected by diastolic failure |
||
A wave higher than E not consistent with severe MR |
|||
|
not quantitative |
||
|
|
||
|
|
|
|
Pulmonary venous flow |
easy |
not accurate if MR jet flows into vein |
|
systolic flow reversal specific for severe MR |
affected by LA pressure |
||
|
|||
|
|
|
Adapted from: Zoghbi W, Enriquez-Sarano M, Foster E, et al. American Society of Echocardiography. Recommendations for evaluation of the severity of native valvular regurgitation with two-dimensional and Doppler echocardiography. J Am Soc Echocardiogr 2003;16:777–802.