


CHAPTER SIX
Hypertensive Heart Disease
Pulmonary Hypertension
Normal pulmonary artery pressure (PAP) is approximately 20–25 mm Hg during systole and 6–10 mm Hg at end diastole with a mean PA pressure of about 12–16 mm Hg. Pulmonary hypertension (PH) is defined as systolic PAP above 25–30 mm Hg and a mean PAP greater than 20 mm Hg (1–3). Pulmonary hypertension may be a primary disease in which no identifiable etiology is present, but more often, it is a secondary disease. Causes of secondary pulmonary arterial hypertension include left heart failure, thromboembolic diseases, chronic respiratory disease, and remodeling in response to left to right shunting cardiac defects (2–11). The term cor pulmonale traditionally is reserved for pulmonary hypertension related to pulmonary disease and excludes all left heart disease as an underlying cause (12). Determining the presence of pulmonary hypertension should be a combination of two-dimensional, M-mode, and Doppler findings.
Normal Pulmonary Artery Pressure
Systolic: 20–25 mm Hg
Diastolic: 6–10 mm Hg
Mean: 12–16
Pulmonary Hypertension
Systolic: >25–30 mm Hg
Mean: >20 mm Hg
Two-Dimensional and M-mode Findings
Mild to moderate pulmonary arterial hypertension may show no two-dimensional abnormalities, and spectral Doppler is necessary to document its presence (10,13). Moderate to severe pulmonary hypertension shows some classic two-dimensional and M-mode changes including right ventricular hypertrophy and dilation, pulmonary artery dilation, septal flattening with paradoxical motion, prolapse of the pulmonary and tricuspid valves, and small apparently hypertrophied left ventricular chamber size (2,10,14–16).
Moderate to Severe Pulmonary Hypertension
Features
Dilated pulmonary artery
RV hypertrophy and dilation
Septal flattening and paradoxical septal motion
Decreased LV chamber size
Prolapse of pulmonic or tricuspid valves
Flattening of the interventricular septum changes the left ventricular chamber from a circular shape to a triangular or D-shaped chamber on transverse views and pushes the interventricular septum down

toward the left ventricular chamber on long-axis views. (Figure 6.1) (2). As the ratio of left to right ventricular chamber size in dogs with pulmonary hypertension becomes less than 1.5, some degree of PSM is present, and this motion will progressively increase as the right ventricular volume overload increases (Figures 6.2, 6.3) (15). The motion is created when right-sided diastolic pressure exceeds left-sided diastolic pressure. This causes the septum to bulge downward during diastole and then correct itself with an exaggerated upward or rightward motion during systole (15,17). Differentiating abnormal septal motion secondary to pressure versus volume overload is dependent upon the timing of the abnormal motion. With volume overload of the right ventricle, diastolic pressure equals or exceeds left ventricular diastolic pressure, but systolic pressure is still much lower than left ventricular systolic pressure. Paradoxical septal motion then occurs during diastole, but the septum returns to its normal position during systole (Figure 6.4). When the right ventricle has a pressure overload secondary to pulmonary hypertension, right ventricular systole lasts longer than left ventricular systole causing downward motion of the septum early in diastole. If right ventricular diastolic pressure is also elevated, as is the case in chronic pulmonary hypertension, the elevated pressure is present throughout systole and diastole, and the septum is persistently deformed and flattened (Figure 6.5) (18–20).
Septal Flattening
Pressure overload from pulmonary hypertension
Flattening during diastole and systole
Volume overload
Flattening during diastole
Figure 6.1 Significant pulmonary hypertension causes flattening of the interventricular septum changing the normally circular transverse left ventricular chamber into a “D” shape. This image also shows right ventricular dilation. RV = right ventricle, LV = left ventricle, plane = right parasternal transverse left ventricle.
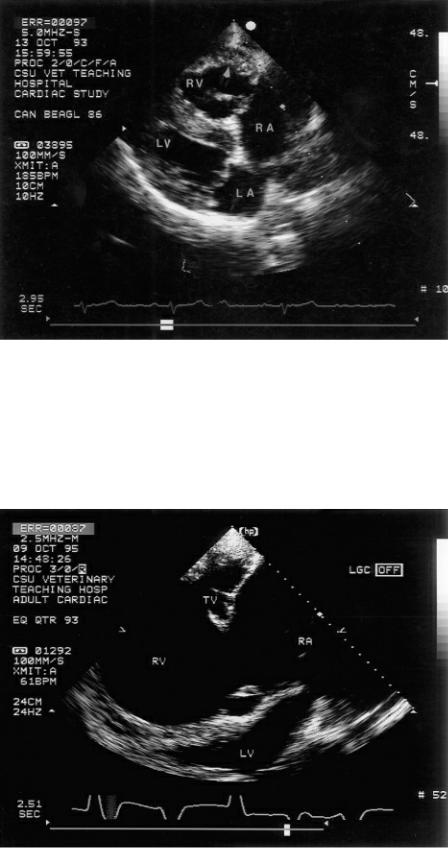
Figure 6.2 Right ventricular dilation as well as hypertrophy are characteristic of hearts with pulmonary hypertension. This dog’s heart shows flattening (bowing) of the ventricular septum toward the left ventricle secondary to the elevated right ventricular pressure. RV = right ventricle, RA = right atrium, LV = left ventricle, LA = left atrium, plane = right parasternal four chamber.
Figure 6.3 Chronic obstructive pulmonary disease with pulmonary hypertension caused severe right ventricular and atrial dilation in this horse’s heart. The ventricular septum bows toward the left ventricle, a sign of paradoxical septal motion, and left ventricular chamber size is very small secondary to poor preload returning from the right heart. RV = right ventricle, TV = tricuspid valve, RA = right atrium, LV = left ventricle.
Figure 6.4 Right ventricular volume overload results in right-sided diastolic pressure that exceed left ventricular diastolic pressure, while right ventricular systolic pressure is usually still lower than left
ventricular diastolic pressure. This causes flattening of the ventricular septum to occur only during diastole when right ventricular volume overload is present. These three images show (A) septal flattening during diastole (arrow), (B) normal septal curvature during systole, and (C) M-mode diastolic paradoxical motion (arrow). RV = right ventricle, VS = ventricular septum, LV = left ventricle, LVW = left ventricular wall.

Figure 6.5 Right ventricular pressure overload secondary to pulmonary hypertension results in diastolic and systolic pressures in the right ventricle that exceed left ventricular pressures during both
phases of the cardiac cycle. This causes flattening of the ventricular septum to occur throughout the cardiac cycle. These three images show (A) septal flattening during diastole (arrow), (B) septal flattening during systole (arrow), and (C) M-mode systolic and diastolic paradoxical septal motion (arrows). RV = right ventricle, VS = ventricular septum, LV = left ventricle, LVW = left ventricular wall.

The paradoxical septal motion can be evaluated using an eccentricity index, which is increased in PH (18,21,22). Eccentricity is evaluated by comparing the ratio of the two minor axes of the left

ventricle on parasternal transverse views (Equation 6.1).
Equation 6.1 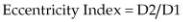
where D2 is the minor axis measured on transverse views of the left ventricle at the level of the chordae tendineae in an axis parallel to the septum and D1 is the axis bisecting the septum and perpendicular to D2. This is measured in systole and diastole.
Normal eccentricity index during systole and diastole is 1, meaning that the ventricle maintains its round shape throughout the cardiac cycle. Right ventricular volume overload causes the left ventricular chamber to be less circular during diastole, but it returns to its circular shape during systole. Therefore, its eccentricity index is increased during diastole (Figure 6.6). Pulmonary hypertension deforms the septum during systole and diastole creating an eccentricity index that is increased throughout the cardiac cycle (18,19). These alterations in shape and motion can also be documented on M-mode images where timing of the motion may be easier.
Eccentricity Index
D2 = axis across LV at chordae
D1 = axis perpendicular to D2
Normal D2/D1 1
D2/D1 >1 = flattening
Figure 6.6 An eccentricity index is calculated by dividing the width of the transverse left ventricular chamber (D2) at the level of the chordae tendinae by the height of the left ventricular chamber (D1). The eccentricity index in this image is 42.62/23.82 = 1.79. A normal eccentricity index should be about 1 during both diastole and systole. RV = right ventricle, LV = left ventricle.
Elevated right atrial pressure causes the interatrial septum to curve toward the left atrial chamber. This creates the appearance of a small left atrial chamber (Figure 6.2). The mitral annulus may also become distorted, and mitral valve prolapse may be present even with normal valvular structure (Figure 6.2). The prolapse usually disappears after resolution of the pulmonary hypertension and return of normal septal motion (23). Elevated right atrial pressure often causes pericardial effusion and coronary sinus dilation in man. The degree of pericardial effusion is directly correlated to right

atrial pressure elevation (24,25). The diameter of the coronary sinus is directly related to right atrial pressure and size and pulmonary artery systolic pressure (Figure 6.7) (26).
Figure 6.7 Elevated right atrial pressure often causes coronary sinus dilation in man. The diameter of the coronary sinus is directly related to right atrial pressure and size and pulmonary artery systolic pressure. LV = left ventricle, RV = right ventricle, RA = right atrium, TV = tricuspid valve, CS = coronary sinus.
Chronic right ventricular systolic pressure overload leads to compensatory right ventricular hypertrophy (Figure 6.2) (2). Right ventricular dilation commonly develops over time (Figures 6.3, 6.8) (6). The lack of right ventricular hypertrophy does not rule out the presence of pulmonary hypertension. In one study, only half of 53 dogs had visible evidence of increased wall thickness (2). Hypertrophy appears to be more common in young dogs than older dogs (2). This may suggest a different compensatory response to elevated pressure. Increased right ventricular volume is subjectively determined from apical four-chamber views when the area of the right ventricle is larger than the area of the left ventricle (Figure 6.9). An apex that includes the right ventricular chamber is also indicative of right ventricular volume overload. Two-dimensional evaluation of right ventricular fractional area shortening is decreased in human patients with significant pulmonary hypertension (21). Fractional area change is calculated by tracing the area of the ventricular chamber in diastole (RVAd) and systole (RVAs) and applying Equation 6.2.
Equation 6.2 
Absence of RVH does not rule out the presence of pulmonary hypertension.
Figure 6.8 (A) The left ventricle can barely be seen in this horse with severe right heart enlargement secondary to pulmonary hypertension. The septum is flattened, a sign of paradoxical septal motion. (B) This long-axis four-chamber view of the heart in a dog shows a dilated right ventricle and dilated right main pulmonary artery segment at the heart base. The right ventricular wall is as thick as the left ventricular wall, a sign of right ventricular hypertrophy. RV = right ventricle, RA = right atrium,
RMPA = right main pulmonary artery, LV = left ventricle, LVW = left ventricular wall, LA = left atrium, VS = ventricular septum.
Figure 6.9 Increased right ventricular volume is subjectively determined from apical four-chamber views when the area of the right ventricle and atrium are larger than the area of the left ventricle and atrium. RV = right ventricle, LV = left ventricle, TV = tricuspid valve, MV = mitral valve, RA = right atrium, LA = left atrium.

Fractional area change of the right ventricular chamber should be approximately 40–45%. This is not always an accurate assessment of function however since the interaction of right and left ventricular pressure alters septal conformation (19). There is also a large range of normal values and no significant correlation with pulmonary artery pressure in man (20). In man, preserved apical function with hypokinesis of the rest of the right ventricular chamber is relatively specific for massive acute PTE (27). Right ventricular dysfunction is not specific for pulmonary hypertension, and dysplasia or infarction should be ruled out. In man there is significantly increased risk of mortality when right ventricular dysfunction is present compared to pulmonary hypertensive patients with preserved function (28).
The main pulmonary artery and sometimes its proximal branches are dilated with chronic and acute elevations in pulmonary vascular pressure (Figures 6.10, 6.11, 6.12) (2,29). The normal relationship of pulmonary artery diameter to aortic root diameter in the dog is .80–1.15, with pulmonary hypertension this ratio becomes greater (13,30). Dilation of the pulmonary artery helps differentiate right heart enlargement secondary to tricuspid valve disease from pulmonary disease. Tricuspid insufficiency without hypertension will not cause the pulmonary artery to dilate and may even cause it to be smaller than normal if the regurgitation is severe and forward flow is compromised. The pulmonary valve may prolapse and balloon back toward the right ventricular chamber (Figures 6.10, 6.11). The prolapse is not specific for pulmonary hypertension however and may also be seen with patent ductus arteriosus and pulmonic stenosis.
RA and RV enlargement without pulmonary artery dilation is not consistent with pulmonary hypertension.
Figure 6.10 Pulmonic valve prolapse or billowing toward the right ventricular chamber may be seen when pulmonary pressures are elevated (arrow). The right ventricle is dilated and hypertrophied. RV = right ventricle, LV = left ventricle, PA = pulmonary artery, plane = right parasternal modified transverse view of the pulmonary artery, species = canine.

Figure 6.11 The dilated right ventricle, atrium, and pulmonary artery are all signs of pulmonary hypertension. The pulmonary valve cusps billow toward the right ventricle during diastole secondary to elevated pulmonary artery pressure (arrow). Notice the dilation involves the entire artery from the valve to the bifurcation, helping to differentiate this from pulmonic stenosis. RA = right atrium, RV = right ventricle, AO = aorta, PA = pulmonary artery.
Figure 6.12 The pulmonary artery is dilated when pulmonary pressure is elevated. Both branches of the pulmonary artery are easily seen. Note that the artery is dilated even at the level of the pulmonic valve, which helps distinguish this dilation from that seen with pulmonic stenosis. A color jet of tricuspid insufficiency is seen. AO = aorta, RV = right ventricle, RA = right atrium, PA = pulmonary artery, RMPA = right main pulmonary artery, LMPA = left main pulmonary artery.

There is evidence in man that acute PTE can be differentiated from chronic cor pulmonale based on the appearance of the vena cava. Dilation of the vena cava during inspiration suggests acute PTE whereas collapse of the vena cava during inspiration suggests chronic pressure overload of the right ventricle (29).
Tricuspid annular plane systolic excursion (TASPE) has been used in man as a predictor of survival in patients with pulmonary arterial hypertension. Tricuspid annular motion is obtained by placing an M-mode cursor over the tricuspid annulus and measuring its amplitude of motion during systole (31). In man, a value of less than 1.8 cm correlates highly with poor right ventricular stroke volume and depressed cardiac index and higher pulmonary vascular resistance. This value also predicted poorer long-term survival. Patients with TASPE less than 1.8 cm had smaller left ventricular chambers and more left ventricular diastolic dysfunction.
Left ventricular chamber size is usually small, and wall and septal thicknesses are typically increased in dogs with moderate to severe pulmonary hypertension. This is presumably secondary to poor preload (Figures 6.2, 6.3) (2,16). There is only a weak correlation between the severity of pulmonary hypertension secondary to left heart failure caused by degenerative mitral valve disease and left ventricular end systolic and end diastolic volume indexes or left atrial to aortic root ratio (r = 0.129, 0.242, and 0.242, respectively) (5). Volume indexes were calculated with the Teicholz equation from M-mode diastolic and systolic chamber sizes. Systolic time intervals may also be abnormal in dogs with moderate to severe pulmonary hypertension. M-mode-derived pre-ejection time (LVPEP) increases, ejection time (LVET) decreases, and the ratio of LVPEP:LVET increases. These are thought to be more likely due to poor preload than systolic failure (10,32). A study in Greenland dogs at high altitude tends to suggest that left ventricular systolic function may be enhanced since these dogs had decreased LVPEP:LVET secondary to decreased LVPEP. Left ventricular chamber size was not different from control in these dogs with pulmonary hypertension (10). These systolic time intervals were obtained from spectral Doppler evaluation of aortic flow. Sympathetic influences were thought to play a role in these findings. Others have found normal echocardiographic parameters of left ventricular function despite poor preload, and the thought is that there is decreased afterload secondary to decreased preload, poor output, and hypotension. Volume cannot move into the left side of the heart when significant pulmonary hypertension is present.

Doppler Evaluation
Tricuspid regurgitation is almost always present when there is pulmonary hypertension. It ranges from mild to severe. This regurgitation may be secondary to annular stretch or changes in right ventricular geometry (19). The severity of the tricuspid insufficiency does not always correlate with the severity of the pulmonary hypertension, but decreases in pressure do change the severity of the regurgitation especially when the cause of the regurgitation was annular dilation (19,33). Applying the Bernoulli equation to the velocity of a tricuspid regurgitant jet provides an estimate of right ventricular systolic pressure. In the absence of pulmonary outflow obstruction, this right ventricular pressure is equal to peak pulmonary artery systolic pressure (Figure 6.13) (34–36). Use the imaging plane that most accurately aligns the Doppler cursor with the regurgitant jet. This may not always by obvious and flow velocities from several imaging planes should be tried. Fan and tilt the transducer so that the ultrasound beam crosses the tricuspid regurgitant jet in the third dimension in order to evaluate all aspects of the flow. A good regurgitant flow profile should be parabolic in shape and encompass at least half of systole (22).
Use tricuspid insufficiency flow velocities to determine the pressure within the right ventricle and pulmonary artery.
Figure 6.13 Pulmonary artery systolic pressure can be measured if tricuspid insufficiency is present. The Bernoulli equation is applied to the tricuspid regurgitant flow velocity to derive a pressure gradient of 87 mm Hg in this dog. Pulmonary artery systolic pressures are at least 87 mm Hg in the absence of pulmonic stenosis.
The same can be done for pulmonary insufficiency. Mean pulmonary artery pressure is derived from early peak pulmonary regurgitant flow velocity and is approximately equal to pulmonary wedge pressure while diastolic pulmonary artery pressure is derived from the end diastolic velocity and pressure gradient (Figure 6.14) (22,35–42).
Pulmonary Regurgitant Flow
Peak early pressure gradient

Mean pulmonary artery pressure
Reflects pulmonary wedge pressure
End diastolic pressure gradient
Diastolic pulmonary artery pressure
Figure 6.14 Mean pulmonary artery pressure is derived from early peak pulmonary regurgitant flow velocity and is approximately equal to pulmonary wedge pressure, while diastolic pulmonary artery pressure is derived from the end diastolic velocity and pressure gradient. In this image, mean pulmonary artery pressure (PR peak PG) is 24.22 mm Hg, and diastolic pulmonary artery pressure (PRend PG) is 4.35 mm Hg. PR = pulmonary regurgitation, PG = pressure gradient, Vmax = maximum velocity.
Underestimation of systolic or diastolic pulmonary artery pressure is possible when the Doppler cursor is not aligned optimally (parallel) with the regurgitant jet. Severe regurgitant volume may also lead to overestimation of the pressure since the modified Bernoulli equation does not take into consideration the proximal flow acceleration that may be significantly elevated and not negligible (2,11,34).
Estimated pulmonary artery pressure in man is dependent upon body mass, gender, and age, as well as several cardiac parameters including left ventricular free wall thickness and left ventricular ejection fraction (22). Pulmonary artery pressure of up to 38 mm Hg are found to be the upper limit of the 95% confidence limit in man using spectral Doppler and applying the Bernoulli equation to the velocity of tricuspid regurgitant jets (42–45). This has not been studied in animals.
Estimation of pulmonary vascular resistance (PVR) has been reported in man using Doppler and two-dimensional echocardiography. Pulmonary vascular resistance in Woods units is calculated using Equation 6.3:
Equation 6.3 
where TRVmax is the maximum velocity of the tricuspid regurgitant jet, RVOTVTI is the flow velocity integral in the right ventricular outflow tract just proximal to the valve using pulsed-wave Doppler, and WU is Woods units (22,46,47). Using this equation, if the tricuspid regurgitant jet has a velocity

of 2.86 m/sec and the right ventricular outflow tract flow velocity integral is 20.8 cm, the ratio of TRVmax:RVOTFVI would equal 0.1375. Inserting this value into Equation 6.3 would yield
Using just the ratio of TRVmax to RVOTFVI, a cutoff value of .2 predicted PVR of <2WU. PVR values greater than 2 are considered to be elevated. This had a specificity of 94%. Calculation of PVR may eliminate the overestimation of PH in hyperdynamic hearts and hearts with significant regurgitant volumes and underestimation of PH in hearts with right heart failure and low output. Another method of calculating PVR uses Equations 6.4 and 6.5 (48).
Equation 6.4 
Equation 6.5 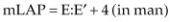
where mPAP is calculated using pulmonary regurgitation peak early pressure gradient, mLAP is mean left atrial pressure, and CO is cardiac output calculated using two-dimensional echocardiography or Doppler flow velocity integrals. In dogs mean left atrial pressure has been estimated using E:E′ (49). Whether using these equations in dogs is applicable remains to be studied.
Pulmonary flow profiles change as pulmonary hypertension develops. All dogs with pulmonary hypertension in one study showed rapid pulmonary artery systolic flow acceleration. This is seen secondary to the elevated rate of rise of right ventricular systolic pressure with the start of right ventricular ejection (2,33). A normal pulmonary artery flow profile with peak flow velocity occurring approximately half way throughout systole is called a Type I flow profile while a rapidly accelerating flow profile is called Type II (Figures 6.15) (2,11,20,22,35,50). This rapidly accelerating pulmonary artery flow results in abnormal right ventricular systolic time intervals including time to peak flow (AT), pre-ejection period, ejection time, and acceleration rate. These all correlate with pulmonary artery pressure in man and in dogs (13,35). Acceleration time (AT) is shortened and the ratio of AT:RVET is decreased in dogs with PH, but it is not always reliable indication of pulmonary hypertension as the shorter time interval and ratio may be found in normal healthy dogs as well (Figure 6.16) (10,35). Statistically the predictive value of AT appears to be more sensitive (80%) and specific (80%) in dogs for predicting PH at a cutoff value of 80 msec than AT:RVET. Values less than 80 msec predict the presence of PH (Table 6.1) (13). Another study in dogs however showed good correlation between the ratio of acceleration time to ejection time (AT/RVET) and pulmonary artery pressures (35). Simply using acceleration time alone did not yield as good a correlation with pulmonary pressures even though the time did decrease with increasing pressures. The correlation coefficient between AT/RVET and systolic pulmonary artery pressures is .84. The regression equation is
Equation 6.6 
where y = systolic pulmonary pressure, and x = AT/RVET.
Pulmonary artery flow acceleration time increases with hypertension:
Type I
Normal flow profile
Type II
Rapid acceleration time
AT <80 msec
Type III
Rapid acceleration

Notching during deceleration
Table 6.1
Predictive Variables for the Presence of Pulmonary Arterial Hypertension
Values lower or higher as indicated are consistent with the presence of pulmonary hypertension. TDI = color tissue Doppler obtained at the RV lateral annulus, E′ = early diastolic myocardial motion, A′ = late diastolic myocardial motion, AT = acceleration time of pulmonary artery flow, msec = milliseconds.
Figure 6.15 (A) Normal pulmonary flow profiles are symmetrical in shape with a rounded peak. This is called a Type I flow profile. (B) As pulmonary artery pressure increases, the flow profile has a more rapid acceleration. This is a Type II flow profile. (C) With even higher pressure, the acceleration time becomes faster and the symmetrical shape is lost. Peak velocity occurs early during systole. This is also called a Type II flow profile.

Figure 6.16 The predictive value of AT appears to be sensitive and specific for predicting PH in dogs. Values less than 80 msec predict the presence of PH. There also appears to be good correlation

between the ratio of acceleration time to ejection time (AT/RVET) and pulmonary artery pressure. AccT = acceleration time, PVET = pulmonary valve ejection time.
Deceleration may appear normal or may have mid to late systolic notching. The presence of systolic notching defines the flow profile as a Type III (Figure 6.17) (2,35,50). This notching of the pulmonary flow profile in mid to late systole is due to partial temporary closure of the pulmonary valve and is fondly called the “flying W.” It is thought to be caused by high pulmonary vascular resistance and reflected systolic pressure from the proximal pulmonary arteries (51). There are reports of notching during pulmonary flow deceleration in dogs with normal pulmonary artery pressure (10). This is hypothesized to be gate location dependent, with changes in flow profiles occurring when the gate is placed too close to the lateral wall or too far into the pulmonary artery (34).
Figure 6.17 Very high pulmonary artery pressure creates mid to late systolic notching during deceleration on this Type III pulmonary flow profile.
Paradoxical septal motion with flattening of the septum during diastole affects left ventricular diastolic function. Early diastolic filling is decreased, and the transmitral E wave is diminished while the atrial contraction, contributing more to left ventricular filling, is represented by a higher A wave (Figure 6.18). This decrease in left ventricular filling is a major contributor to the pronounced decrease in left ventricular cardiac output seen with acute pulmonary hypertension secondary to massive PTE (19). In man studies have shown that the mitral valve E:A ratio correlates directly with cardiac output and inversely with pulmonary artery pressure (20,52). Chronic pulmonary hypertension usually has preserved right ventricular systolic function as the heart slowly remodels in response to chronic pressure increases. As a result, transmitral E waves can be normal in these patients compared to patients with acute pulmonary hypertension (53).
Figure 6.18 Reduced preload within the left ventricle secondary to pulmonary hypertension will cause the mitral valve E:A ratio to reverse.
Differentiating chronic from acute pulmonary hypertension is difficult. Acute pulmonary hypertension secondary to thromboembolic (PTE) events results in right ventricular volume overload, a dilated pulmonary artery, usually tricuspid regurgitation, right ventricular hypokinesis, paradoxical systolic septal motion, and septal flattening (29). Chronic hypertension leads to right ventricular hypertrophy with eventual dilation and systolic failure. Distensibility of the pulmonary artery has been used in man to differentiate patients with chronic pulmonary hypertension from those with acute pulmonary hypertension secondary to thromboembolic events (PTE). Distensibility is measured as the maximal systolic pulmonary artery diameter minus the minimal diastolic pulmonary artery diameter. The measurements are made in the main pulmonary artery segment, 2 to 3 centimeters distal to the valve, in a view that shows the bifurcation (Figure 6.19). Distensibility in patients with chronic pulmonary hypertension is low while the vessel is more reactive when pulmonary artery pressure elevates secondary to PTE. Distensibility is still lower in both of these causes of hypertension when compared to the pulmonary artery of normal individuals. In this study the pulmonary artery remained dilated in patients with acute PTE, but distensibility improved after 3 months of anticoagulation therapy (53).

Pulmonary Artery Distensibility
May help differentiate chronic pulmonary hypertension from acute pulmonary hypertension secondary to PTE.
Figure 6.19 Distensibility is measured as maximal systolic pulmonary artery diameter minus minimal diastolic pulmonary artery diameter. The vessel is more reactive when pulmonary artery pressure elevates secondary to PTE in man. Here pulmonary artery distensibility is 1.23. PTE = pulmonary thromboembolism, RV = right ventricle, RA = right atrium, AO = aorta, PA = pulmonary artery, PV = pulmonary valve.
Tissue Doppler
There is a relationship between tissue Doppler parameters of the right ventricular myocardium and pulmonary hypertension. Using a 2- by 2-mm gate placed at the level of the tricuspid annulus in the middle of the myocardium, color-tissue variables have been studied and used to predict the presence and degree of pulmonary hypertension in dogs (13). The right ventricular Tei index using color-tissue Doppler has been studied in dogs with normal PAP and dogs with PH (Equation 4.29). A Tei index (MPI) of .25 is the cutoff value, with a value greater than this predicting PH with a specificity of 80%

and a sensitivity of (78%) (13). Global TDI, derived by Equation 6.7, is statistically different between dogs with normal, mildly elevated, and significantly elevated PAP (Figure 6.20).
Equation 6.7 
Figure 6.20 Global TDI, derived by Equation 6.7, is statistically different between dogs with normal, mildly elevated, and significantly elevated pulmonary artery pressure. Values less than 11.8 cm/sec suggest pulmonary hypertension. Here the global TDI is 14.36.
The systolic (S′) and diastolic waves (E′ and A′) in Equation 6.7 are obtained from color-tissue Doppler imaging of the right ventricular wall at the tricuspid annulus. Global TDI has the highest sensitivity (89%) and specificity (93%) at predicting the presence of PH at a cutoff value of 11.8 cm/sec (Table 6.1). Values less than this suggest PH (13). A cutoff value of 12.7 cm/sec can be used to differentiate equivocal PH from dogs with normal PAP with a specificity and sensitivity of 88% each.
Color TDI RV Tei index
>.25 is consistent with pulmonary hypertension
Global Color TDI
<11.8 is consistent with pulmonary hypertension
A study in man has determined that the use of right ventricular pulsed-wave tissue Doppler derived Tei index (MPI) and transmitral valve flow E wave can be useful in determining whether pulmonary embolism (PE) is responsible for PH. They defined an M index (Equation 6.8) with values less than 112 being predictive of PE as a cause of PH. This parameter had 92% sensitivity and specificity (54).
Equation 6.8 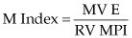
This parameter has not been studied in animals.
Tissue Doppler tricuspid systolic annular velocity (S′) is altered in patients with pulmonary hypertension in man and in dogs (55). A cutoff value of 10.5 cm/sec however is only 69 and 68%

sensitive and specific in dogs, respectively (13). Color-tissue Doppler E′:A′ however is more predictive of PH (89% sensitive and 90% specific) at a threshold of 1.12 (Figure 6.20). Values lower than 1.12 are consistent with the diagnosis of elevated pulmonary artery pressure (13).
Left atrial pressure can be estimated using tissue Doppler and transmitral flow pulsed-wave signals. An E:E′ ratio of less than 6 in dogs is consistent with normal pulmonary venous pressure while a value higher than that is consistent with possible pulmonary venous hypertension as a potential cause of pulmonary arterial hypertension. There is much overlap in pressure between ratios of 6 and 7. In man this ratio is 95% sensitive and 96% specific for separating normal from abnormal pulmonary venous hypertension (56).
Heartworms
When heartworms are the underlying cause of pulmonary hypertension, they can at times be detected on two-dimensional echocardiographic images. Although M-mode images can document the presence of heartworms within the right side of the heart, two-dimensional images are more sensitive (16). Linear echoes representing the worms can be seen within the chambers of the right heart. The linear echoes are typically two parallel lines separated by a very thin hypoechoic area (Figure 6.21) (16). When the heartworm load is massive, the worms may be displayed as an echogenic mass within the chambers (Figure 6.22). This mass may be seen moving back and forth within the chambers, the pulmonary artery, or through the tricuspid annulus as flow varies during systole and diastole. The absence of echocardiographically displayed heartworms does not support the absence of the worms. If the ultrasound beam is not directed perpendicularly to the worms, they may not be detected. Additionally, if the heartworms are within the pulmonary arteries beyond the bifurcation, they will also not be seen (16).
Figure 6.21 Heartworms (arrows) are seen in the main pulmonary artery segment and the right branch of the pulmonary artery. Heartworms look like two parallel lines on echocardiographic images. RV = right ventricle, RA = right atrium, AO = aorta, PA = pulmonary artery.
Figure 6.22 Heartworms (arrows) are seen filling the right atrial chamber of this dog. RV = right ventricle, RA = right atrium, LV = left ventricle, LA = left atrium.