


Outflow Obstructions

Aortic Stenosis
Subaortic stenosis is a common defect in large breed dogs. Tidholm found that the incidence of aortic stenosis in these dogs was 35%, and the occurrence of pulmonic stenosis was 20% in a retrospective study of 151 dogs (4). The Golden Retriever, Rottweiler, Boxer, German Shepherd, and Newfoundland are among the breeds most susceptible to this congenital defect (2,5). Aortic stenosis is rare in the cat and cow, but features of the disease are similar to those found in dogs and man (6–14). Aortic stenosis may manifest itself as supravalvular, valvular, or subvalvular. Although supravalvular stenosis is extremely rare, it is reported in the cat and was accompanied by a valvular aortic stenosis (13). Valvular aortic stenosis is also rarely seen as a single entity but does occur in conjunction with the most common form of stenosis, the subvalvular obstruction, which is seen in greater than 90% of dogs with aortic stenosis (15,16). The main manifestations of subaortic stenosis are a narrowed left ventricular outflow tract secondary to nodules or a ridge of fibrous tissue, or an aortic valve area secondary to commissural fusion of the cusps, concentric left ventricular hypertrophy, and increased blood flow velocity through the stenotic area (2,14,15,17).
Subvalvular Aortic Stenosis
Features of the Obstruction
Fibrous ring or nodules are proximal to the aortic valve.
Ring may pull mitral valve up to outflow tract.
Small fibrous tissue may not be seen.
If a dynamic component is present, the band usually extends from it.
Rarely the anterior mitral valve is stiff and creates a tunnel.
Less commonly there may be hypoplasia of the annulus.
A complete echocardiographic exam in animals with suspected aortic stenosis includes all standard rightand left-imaging planes in order to optimize images of the outflow tract and aorta. The echocardiogram should provide information about mitral valve morphology and motion, aortic valve cusp anatomy and motion, visualization of a normal left coronary artery, poststenotic dilation of the ascending aorta, narrowing of the outflow tract, and accurate flow velocity within the outflow tract and aorta (15). Right parasternal imaging planes of the outflow tract should identify the type of lesion, provide insight to mitral and aortic valve motion, and is used for color-flow analysis. Transverse views from the right and left help assess the size of the outflow tract at the level of the obstruction relative to the aortic root and are often best at defining aortic valve motion. Apical and subcostal views not only provide structural information but are also used to obtain flow velocity and pressure gradients. Make sure to screen for other concurrent congenital defects. Pulmonic stenosis, patent ductus arteriosus, ventricular septal defect, and mitral valve dysplasia have all been reported to occur with aortic stenosis (15).
Echocardiographic evaluation of aortic stenosis should include:
Mitral valve morphology
Mitral valve motion
Aortic valve anatomy
Determine the presence of a normal left coronary artery
Identify a poststenotic dilation
Left ventricular outflow tact morphology
Flow velocity of the outflow tract and aorta
Two-Dimensional Evaluation
Class one and two left ventricular outflow obstruction is discrete and fixed. A fibrous ridge of tissue (class two) or nodules (class one) are present within the left ventricular outflow tract. The fibrous band of tissue may be small and encircle the outflow tract with very little protrusion into the lumen of the tract or it may be extensive, creating a small orifice for blood flow (15). Fibrous rings may be seen just proximal to the aortic valve on right parasternal left ventricular outflow and transverse views (Figures 10.2, 10.3) (2,15). Small fibrous bands may not be visualized. Nodules on the ventricular side of the aortic valve are also described and fall into this category of obstruction (10,18,19). The development of the subvalvular obstruction is progressive as the animal grows, and although echocardiographic examination may not show any abnormality of the outflow tract in young dogs, this may not be the case when the dog is older (6,10,15,20–23). Fan the transducer in and out of the longaxis and transverse planes in order to bring the obstructive band into view. The ring is usually close to the aortic valve annulus, but it may be seen further down into the outflow tract several millimeters away from the annulus (Figure 10.4).
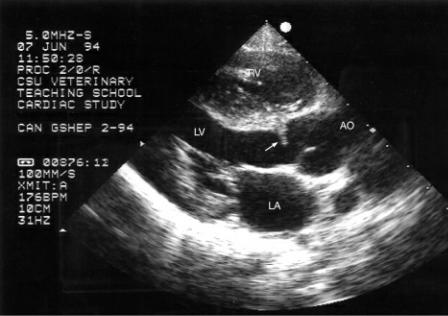
Figure 10.2 A fibrous band (arrow) is seen just below the aortic valve in this dog with subvalvular aortic stenosis. There is visible concentric left ventricular hypertrophy but no apparent muscular obstruction. Plane = right parasternal left ventricular outflow view, RV = right ventricle, LV = left ventricle, AO = aorta, LA = left atrium.
Figure 10.3 Muscular hypertrophy of the ventricular septum (short arrow) and a fibrous nodule (small arrow) are seen just proximal to the aortic valve in this dog with subvalvular aortic stenosis. A hint of a poststenotic dilation (long arrow) can also be seen. Plane = left cranial long axis, LV = left ventricle, AO = aorta, AOV = aortic valve, LA = left atrium.

Figure 10.4 The fibrous tissue creating outflow obstruction (arrow) is located farther down in the left ventricular outflow tract of this dog. There is no visible dynamic component. Plane = modified right parasternal long-axis left ventricular outflow view, LV = left ventricle, AOV = aortic valve, LA = left atrium.
The band of tissue may be reflected onto the mitral annulus, and this can be appreciated on twodimensional images (24). The mitral valve leaflet is pulled up toward the outflow tract before extending into the ventricular chamber instead of extending straight out from the posterior aortic wall as it normally would (Figure 10.5). A feature that is thought to differentiate congenital fixed subaortic stenosis from dynamic obstructive hypertrophic cardiomyopathy in the cat is the absence of systolic anterior mitral valve motion in cats with aortic stenosis (25).
Figure 10.5 The mitral valve is pulled up toward the outflow tract (large arrow), a sign that a ring is present even when a fibrous band is not apparent. There is a nodule at the base of the septum in this dog (small arrow). The left atrium and ventricle appear dilated suggesting that a concurrent problem creating volume overload is also present. Plane = right parasternal long-axis left ventricular outflow view, RV = right ventricle, RA = right atrium, VS = ventricular septum, LV = left ventricle, AO =

aorta, LA = left atrium, LVW = left ventricular wall, CT = chordae tendinae.
Subaortic stenosis may also manifest itself as a dynamic obstruction involving hypertrophy or a muscular ridge at the base of the interventricular septum. This is best seen on right or left parasternal long-axis left ventricular outflow views. The muscle thickens into the outflow tract and during contraction the obstruction becomes even greater (Figure 10.6) (7). The degree of obstruction and variations in flow velocity can occur from beat to beat depending upon loading conditions, heart rate, and sympathetic stimulation (26). Dynamic and fixed obstructions may occur together, and typically, the fibrous ring extends from the base of the septum at its maximum extension into the outflow tract (Figure 10.7).
Figure 10.6 Significant concentric hypertrophy is present in this dog with dynamic subvalvular obstruction. The muscle protrudes into the outflow tract (arrow). There is no visible ring. Plane = right parasternal long-axis left ventricular outflow view, RV = right ventricle, VS = ventricular septum, AO = aorta, LA = left atrium, LVW = left ventricular wall.
Figure 10.7 The fibrous ring typically extends from the base of the septum at its maximum extension

into the outflow tract when both dynamic and discrete obstructions are present (arrow). Plane = right parasternal long-axis left ventricular outflow view, LV = left ventricle, AO = aorta, LA = left atrium.
Class III subaortic stenosis involves a tunnel type of stenosis (10,18,19). The mitral valve is stiff and forms the posterior wall of an obstructive subvalvular tunnel while the septum forms the anterior wall of the tunnel (Figure 10.8). The mitral valve may be dysplastic. A fibrous band may be present but is often difficult to see in these hearts. The width of the tunnel is much less than the width of the aorta (24).
Figure 10.8 (A) A stiff anterior mitral valve leaflet helps form a tunnel type of subvalvular stenosis (arrow). On real-time images the mitral valve would show very limited motion and may be insufficient. A small muscular ridge is seen in the outflow tract as well (small arrow). (B) This dog with a tunnel form of subaortic stenosis (arrow) also has a hypoplastic annulus. Planes = right parasternal long-axis left ventricular outflow view, RV = right ventricle, LV = left ventricle, VS = ventricular septum, LA = left atrium, AO = aorta, MV = mitral valve, AOV = aortic valve, LVW = left ventricular wall.
The annulus of the aorta may also be affected. A small diameter at the level of the leaflets is seen when hypoplasia of the aorta exists (Figure 10.8b, Figure 10.9). This form of stenosis seems to occur frequently in Boxers and is reported in calves (12,15). There may or may not be dynamic obstruction or a subvalvular membrane with this type of stenosis.
Figure 10.9 The infundibular hypertrophy creating outflow obstruction is clearly visible here (arrow). The aortic annular diameter is small, consistent with hypoplasia. There is volume overload of the left ventricular and atrial chambers. A valvular insufficiency, shunt, or myocardial dysfunction should be suspected when volume overload exists as well as hypertrophy in young animals with subaortic stenosis. Plane = right parasternal long-axis left ventricular outflow view, RV = right ventricle, AO = aorta, LV = left ventricle, LA = left atrium.

Partial fusion of the cusps can exist and may be seen on longor short-axis views of the aortic valves (Figure 10.10). Asymmetric opening of the cusps is especially easy to see on transverse views of the heart base (15). This is difficult to identify on M-mode images since reduced flow through the valves will cause incomplete opening of the valve on M-mode images. Stiff immobile leaflets without fusion may be seen with any of the manifestations of aortic stenosis especially in Boxers and cats (Figure 10.11) (21,27,28). Aortic valve dysplasia has been reported in the cow where thick malformed cusps caused stenosis and significant insufficiency (12).
Figure 10.10 The aortic valve cusps do not open completely on this transverse view of the valve suggesting some degree of commissural fusion (arrow). Plane = right parasternal transverse heart base, RA = right atrium, LA = left atrium.
Figure 10.11 Stiff immobile aortic valve cusps without fusion are barely separated at maximal opening (arrows). This can be seen on both (A) long-axis and (B) transverse right parasternal views. RV = right ventricle, LV = left ventricle, LA = left atrium, RA = right atrium, AOV = aortic valve.

The poststenotic dilation observed with aortic stenosis may be seen on right parasternal long-axis left ventricular outflow views of the heart, but it is best seen on left parasternal cranial long-axis images of the left ventricular outflow tract and aorta (Figure 10.12). The walls of the aorta diverge away from each other distal to the aortic valves. The sinus of Valsalva is often dilated, and sometimes one or both coronary artery ostia may be dilated as well.
Figure 10.12 The walls of the aorta diverge away from each other in poststenotic dilation of the ascending aorta. The mitral valve is pulled up toward the outflow tract (arrow) suggesting the presence of a fibrous band even though it is not seen. There is very mild aortic insufficiency. Plane = right parasternal long-axis left ventricular outflow view, RV = right ventricle, LV = left ventricle, LA = left atrium, AO = aorta.

Comparison of the left ventricular outflow tract cross-sectional area to the aortic root crosssectional area can provide additional information regarding the severity of the subaortic stenosis especially when flow velocity is affected by factors other than the stenosis (2). Using a right parasternal transverse view of the left ventricular outflow tract at the level of the obstruction and of the aorta at the level of the sinus of Valsalva during diastole, trace the cross-sectional area along the inner edge of the myocardium for each (Figure 10.13). This ratio predicted severity of the subaortic stenosis more than the degree of hypertrophy. Normal canine hearts have an LVOT : AO ratio of
.509–.737. Moderate and severe subaortic stenosis could be predicted by statistically significant differences in this ratio from normal and between each other. Ratios of >0.5, 0.3–0.5, and <0.3 differentiated mild, moderate, and severe obstructions to flow. Mild obstruction to outflow and normal hearts do not have statistically different LVOT : AO ratios.
Cross-Sectional Area of Stenosis
Area at transverse obstruction
Area at sinus of Valsalva
Normal LVOT : AO = .509 − .737
.3 − 5 = moderate severity <.3 = severe stenosis
>.5 = mild stenosis
Useful in low or high stroke volume settings Overlap between normal and mild
Figure 10.13 Comparison of the left ventricular outflow tract cross-sectional area (A) to the aortic root at the level of the sinus of Valsalva cross-sectional area (B) can provide additional information regarding the severity of the subaortic stenosis especially when flow velocity is affected by factors other than the stenosis. Outflow tract to aortic root ratios of >0.5, 0.3–0.5, and <0.3 differentiate mild, moderate, and severe obstructions to flow. The ratio here is .31.

Effective orifice area is calculated in man to assess the severity of valvular aortic stenosis. Bélanger et al. found a correlation between calculated effective outflow tract area and pressure gradient across the outflow tract in dogs (29). The continuity principle states that barring any shunts or insufficiencies, volumes moving through two different places in the heart, in this case, the left ventricular outflow tract and the aortic root, must be equal as shown in Equation 10.1:
Equation 10.1 
Where CSA = cross-sectional area, FVI = flow velocity integral, LVOT = left ventricular outflow tract, and AO = aorta.
Normal Aortic IEOA
≥1.25 cm2/m2
Puppies
Normal aortic EOA
1.58 ± 1.0 cm2
Normal aortic IEOA
2.42 ± .85 cm2/m2
Adults
Normal aortic EOA

2.34 ± .78 cm2
Normal aortic IEOA
2.22 ± .76 cm2/m2
IEOA in SAS
<.6 cm2/m2
Significant obstruction
High incidence of adverse events
Using this principle, we can rearrange the equation to calculate stenotic area size and effective orifice area (EOA) (Equation 10.2).
Equation 10.2 
This works well in man, where the stenosis is typically valvular. In dogs, the obstruction is usually subvalvular, and it is not possible to record outflow tract and aortic velocity separately. Since flow velocity integrals (FVI) are proportionate to volume flowing through the vessel, Bélanger used the right ventricular outflow tract FVI multiplied by CSA of the pulmonary valve to represent normal stroke volume and compared it to FVI multiplied by CSA of the LVOT in order to determine the effective orifice area of the stenosis. Equation 10.3 follows:
Equation 10.3 
This can be rearranged to (Equation 10.4):
Equation 10.4 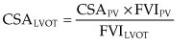
This has some inherent problems in that right ventricular outflow volume calculations do not always match LVOT volume calculations, but they did find good correlation between peak and mean gradients calculated by Doppler in subaortic stenosis and EOA (26,30). A normal EOA in puppies (weight from 7–22 kg) is 1.58 ± 1.0 cm2, corrected for body size the indexed EOA (IEOA) is 2.42 ±
.85 cm2/m2. In adult dogs (weight from 30–38 kg), a normal EOA is 2.34 ± .78 cm2, the IEOA is 2.22
± .76 cm2/m2. A normal IEOA in the canine left ventricular outflow tract is ≥1.25 cm 2/m2 (31). IEOA correlated better than EOA itself with severity and clinical signs in dogs with subaortic stenosis. An IEOA of <1.0 cm2/m2 implies significant obstruction to flow, and an IEOA of <.6 cm2/m2 is significantly correlated with adverse events. As in the ratio of LVOT to AO, EOA cannot differentiate between mild stenosis and normal LVOT. This may be of use in the evaluation of SAS in dogs with poor systolic function or in dogs that have been put on negative inotropic drugs where pressure gradients will underestimate the significance of the stenosis or in patients that have undergone interventional techniques that result in valvular regurgitation at the aortic valve where pressure gradients will overestimate the severity of the stenosis (26).
Focal areas of increased echogenicity are indicative of myocardial fibrosis (Figure 10.14). This is typically seen in more severely affected animals, and myocardial function may be compromised if the fibrosis is extensive. The papillary muscles and the base of the ventricular septum are common sites for fibrosis (Figure 10.14). The increased echogenicity is easily seen on transverse and long-axis views (7,16). Perhaps the variability, duration, frequency, and severity of dynamic obstruction on a day-to-day basis play a role in the degree of hypertrophy as is seen in man with systemic hypertension. The degree of hypertrophy in human patients with hypertension is variable and is greatly dependent upon the duration, frequency, and severity of hypertension during daily activities
(32). Some animals have very little if any obstruction at rest but have dramatic gradients when excited as might be expected during some echocardiographic exams.
Figure 10.14 Areas of increased echogenicity within the myocardium are indicative of myocardial fibrosis. (A) This interventricular septum contains multiple hyperechoic areas consistent with fibrosis (arrow). (B) and (C) Papillary muscles are common sites of fibrosis (arrows). Planes: A = right parasternal long-axis four-chamber view, B = right parasternal left ventricular outflow view, C = right parasternal transverse LV, LV = left ventricle, RA = right atrium, RV = right ventricle, LA = left atrium, AO = aorta.

M-Mode Evaluation

Measurement of the left ventricular free wall and septum will reveal the presence of hypertrophy (2,16,24,33–35). The hypertrophic response to increased pressure occurs in order to maintain normal wall stress and systolic function. The ratios of ventricular septum to left ventricular diastolic chamber size in diastole and left ventricular wall to left ventricular diastolic chamber size are increased, and a direct correlation between the degree of hypertrophy and the severity of the stenosis has been documented in Boxers (35). The ratio of septum to left ventricular chamber size in a normal canine hearts is .22–.34 (36). The degree of concentric hypertrophy does not always correlate well with the severity of outflow obstruction and pressure gradient in aortic stenosis in other breeds. Mild hypertrophy is sometimes seen with Doppler documented moderate to severe obstructions; therefore, hypertrophy cannot be used as an indicator of severity. An inadequate degree of hypertrophy in response to the obstruction can result in early development of systolic myocardial failure and congestive heart failure (2,35,37–40). In man, patients with significant hypertrophy secondary to their stenosis have excellent systolic function but are prone to decreased myocardial perfusion leading to ischemia, fibrosis, and arrhythmia (2,37).
Degree of LVH in SAS
Does not correlate well with severity
Left atrial enlargement is sometimes seen in dogs and cats with aortic stenosis (Figures 10.8, 10.9) (8,34). There are several potential causes for atrial dilation with subaortic stenosis. Systolic anterior motion of the mitral valve invariably causes the valve to leak. Mitral valve involvement with the subvalvular fibrous band of tissue may lead to insufficiency secondary to structural or functional abnormalities. Some degree of mitral insufficiency is seen in many dogs with aortic stenosis (17,24). There may also be diastolic dysfunction leading to a dilated left atrium as the failure progresses (2,8,34,35,37–40).
Assessment of Function
Young animals with aortic stenosis have high fractional shortening, and velocity of circumferential shortening is increased (33,34). Ejection time is also typically normal (34). Mitral annular motion (MAM), a parameter of systolic function (see Chapter 4 for more details), is decreased in Boxer dogs with severe subaortic stenosis, although in another study consisting of a variety of breeds and sizes, it appeared that MAM in SAS hearts was not different from normal hearts. Indexed MAM is significantly different between normal hearts and between hearts in Boxers with mild, moderate, and severe aortic stenosis (35,41). Boxer dogs with severe subaortic stenosis, pressure gradient >80 mm Hg, had indexed MAM of .79–.99 cm (normal = .88–2.0 cm).
MAM depressed in severe SAS in Boxers
Normal indexed MAM
.88 − 2.0 cm
Severe SAS (PG >80) − indexed MAM
.79 − .99
Diastolic failure has been documented in Boxers (34%) (35). A major contributor to clinical signs of exercise intolerance, lethargy, and dyspnea in people is the presence of diastolic dysfunction (6,35,42,43). The compensatory left ventricular hypertrophy in aortic stenosis possibly leads to
impaired diastolic function. Grades of diastolic function (see Chapter 4 for details) are listed in Table 4.3 (35). Pseudonormal transmitral flow is the most common manifestation of diastolic impairment on echocardiographic studies in these dogs and was seen in 11 out of 23 Boxers with mild to severe outflow obstruction, and of these dogs, 58% had exercise intolerance and syncopal episodes. This pattern of diastolic dysfunction was seen in 4 dogs with mild obstruction, but 2 also had pulmonic stenosis that will cause septal hypertrophy and possibly poor left ventricular filling (preload). Two had moderate aortic regurgitation that can affect left ventricular diastolic pressure. Whether these dogs truly had impaired diastolic function is not known. Delayed relaxation was seen nearly as frequently with 10 of the 23 dogs having IVRT periods greater than 69 msec. Only 2 of the 23 Boxers with aortic stenosis had a restrictive pattern of left ventricular filling.
Dynamic outflow obstruction displays the same type of M-mode echocardiographic findings as those seen with obstruction secondary to hypertrophic cardiomyopathy. Systolic anterior motion of the mitral valve confirms the presence of high velocity flow within the outflow tract. As in hypertrophic obstructive cardiomyopathy, the degree and duration of systolic anterior motion is indicative of how severe the gradient is. Longer apposition to the septum is associated with more severe obstruction (44). Early systolic closure of the aortic valve is seen in almost half of dogs with aortic stenosis because flow is interrupted secondary to the obstruction. Systolic closure is seen with both discrete and dynamic aortic stenosis (Figure 10.15) (14,24,33,45).
Figure 10.15 (A) and (B) Early or mid-systolic closure of the aortic valve (arrows) is seen in almost half of dogs with aortic stenosis. It may be seen with both discrete and dynamic obstructions to flow. AO = aorta, AOV = aortic valve, LA = left atrium.
Color-Flow Doppler Evaluation
Valvular insufficiencies will add volume to the concentrically hypertrophied heart. When quantitative

assessment of the left ventricle in a young animal reveals increased left ventricular diastolic chamber size despite hypertrophy of the wall and septum and a discrete aortic stenosis is clearly apparent, then significant valvular insufficiency or a shunt of some type is typically present (Figures 10.8, 10.9). Myocardial failure in older dogs may affect the ability of the heart to hypertrophy adequately, and a more eccentric pattern of enlargement may be seen in these dogs (35).
Both mitral and aortic insufficiencies are seen with subaortic stenosis (6,21,24,35). Mitral insufficiency may be secondary to mitral valve dysplasia that primarily affects the chordae tendinaea, some of which may attach to the subvalvular ring or secondary to systolic anterior mitral valve motion (7,15,24). Aortic insufficiency has been reported in anywhere from half to more than three-quarters of dogs with aortic stenosis (Figure 10.16) (24,46). Aortic insufficiency may cause diastolic flutter of the septal mitral valve leaflet (47). Infective endocarditis is a complication that may develop as the animal becomes older and was seen in approximately 5% of dogs with subaortic stenosis in one study
(6). Congestive heart failure may develop because of the significant aortic or mitral insufficiency that develops secondary to infective endocarditis. Congestive heart failure is otherwise uncommon in dogs with subaortic stenosis (6,21).
Aortic regurgitation seen
50 − 75% of dogs with SAS
Figure 10.16 Aortic insufficiency is present in over three-quarters of dogs with aortic stenosis. The insufficiency here is moderate. Plane = right parasternal long-axis left ventricular outflow view, RV = right ventricle, LV = left ventricle, AO = aorta, LA = left atrium.
Color-flow Doppler identifies the turbulent and high velocity blood flow through the outflow tract and aorta. The aliased color signal helps identify the length and location of a subvalvular obstruction (Figures 10.17, 10.18, 10.19). Color-flow Doppler if available should also be used to help align the spectral Doppler cursor. Although color-flow Doppler is not necessary in order to evaluate the severity of the stenosis, it helps rapidly identify other complicating factors such as insufficiencies and concurrent shunts.
Figure 10.17 The aliased color-flow pattern starts at the level of obstruction in this dog with both

dynamic and discrete obstruction. (A) Long-axis image without color showing the subvalvular obstruction (arrow). (B) Long axis with color showing that turbulence starts at the obstruction. Plane = right parasternal long-axis left ventricular outflow view, LV = left ventricle, AO = aorta, LA = left atrium, LVW = left ventricular wall, VS = ventricular septum, RV = right ventricle.
Figure 10.18 The aliased color-flow pattern starts at the point where the infundibular septum has its maximal excursion into the outflow tract of this dog with subvalvular dynamic obstruction. Plane = right parasternal long-axis left ventricular outflow view, LV = left ventricle, LA = left atrium, AO = aorta.
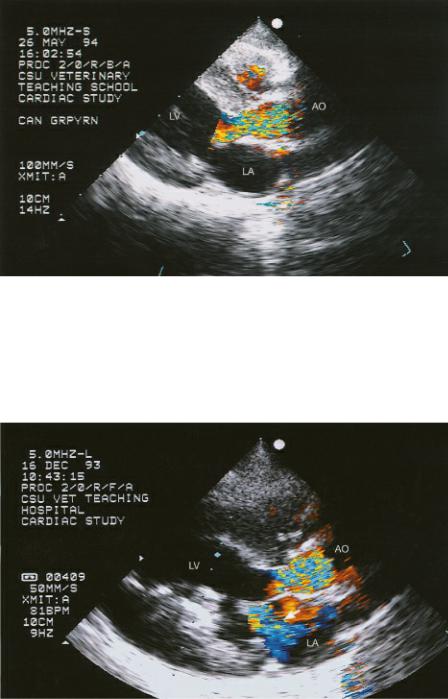
Figure 10.19 Color-flow Doppler shows both outflow obstruction and mitral insufficiency (arrow) in this dog with dynamic obstruction. The mitral valve is pulled up toward the outflow tract implying the presence of a fibrous ring as well. There is fibrosis within the papillary muscle. Plane = right parasternal long-axis left ventricular outflow view, LV = left ventricle, LA = left atrium, AO = aorta.
Spectral Doppler Evaluation
High velocity flow obtained through the left ventricular outflow tract or aorta is the defining feature of obstruction to outflow. The correlation between pressure gradients obtained from Doppler examination of outflow tract flow and catheter-derived pressure gradients is high (48). The principle of conservation of mass states that in a closed system, velocity must increase as flow moves through a discrete narrower area. The modified Bernoulli equation can be applied (see Chapter 4 for details) to the peak velocity, and a pressure gradient is calculated (49,50). Left and right parasternal apical fivechamber views and the subcostal five-chamber view of the heart are used to record spectral Doppler flow through the stenotic region and aorta. Studies have shown that the optimal window for recording the flow velocities in aortic stenosis whether using a dedicated Doppler probe or an imaging transducer is the subcostal window (2,15,17,51).
This subcostal imaging plane for aortic flow velocity is recommended when examining dogs with suspected subaortic stenosis as parasternal apical views may not provide appropriate alignment with

the stenosis and its maximal velocity (15). Maximal velocities were underestimated by 26% when flow was interrogated on left apical windows as compared to subcostal windows (2). While the subcostal five-chamber view yields the highest flow velocities in hearts with SAS, flow velocities and pressure gradients obtained from the left parasternal apical view and those obtained from an apex up right parasternal image are not significantly different in normal dogs and cats (52). There is no documented difference between maximum velocity obtained using high pulse repetition frequency and continuous-wave Doppler at any transducer location (51). Heart rate and body weight do not affect maximal velocity except for a slight relationship between body weight and peak velocity when using HPRF at the apical location (51). Forward stroke volume does affect flow velocity and the calculated pressure gradient. Decreases in forward flow caused by myocardial failure, mitral regurgitation, and any sedative or anesthesia will result in underestimation of disease severity (26). Continuous-wave Doppler and low transducer frequency should be used for evaluation of left ventricular outflow tract and aortic root flow velocities because of better signal strength at that depth from lower frequency transducers. Pulsed-wave Doppler is rarely capable of recording a nonaliased flow signal from apical and subcostal transducer locations when flow velocity is elevated (15).
Two-dimensional images do not show evidence of abnormalities when obstruction is mild (2,17). Pulsed-wave Doppler can be used to identify the exact location of the obstruction but is of little value otherwise in assessing the high velocity flow of aortic stenosis. Move the gate along the outflow tract and into the aorta. Although there is a slight step up in velocity across the left ventricular outflow tract as blood approaches the aortic valve in the normal heart, an aliased signal will be seen when the high velocity flow secondary to the obstruction is met (51). Continuous-wave Doppler will record the high velocity flow through the stenotic region, and the Bernoulli equation can be applied in order to calculate a pressure gradient. The Doppler ultrasound beam needs to be as parallel with flow as possible in order to derive accurate measures of velocity. Deviation from parallel by greater than 15 to 20° will significantly underestimate the severity of the obstruction (53,54). The site of the stenosis does not always line up with the aortic walls, and the beam might not be placed parallel to the aortic walls as they usually are when interrogating aortic flow for other reasons. The outflow tract is typically aligned at an angle toward the mitral valve leaflets in the presence of subvalvular aortic stenosis, and all possible angles should be interrogated in order to determine what the highest velocity truly is (Figure 10.20).
PW Doppler can locate the site of obstruction.
Figure 10.20 The outflow tract may not be in line with the aorta when subvalvular obstruction exists. The Doppler beam should be aligned along the outflow tract if subvalvular stenosis is present as opposed to being parallel to the walls of the aorta. Color-flow Doppler, if available, can identify the direction of high velocity flow. Plane = left parasternal apical five-chamber view, LV = left ventricle, RA = right atrium, AO = aorta, LA = left atrium.

The flow profile is somewhat different from that seen with normal aortic or outflow tract flow. Peak velocity is reached closer to the midpoint of ventricular systole as opposed to within the first third of systole (Figures 10.21, 10.22). The flow profile becomes more symmetrical as the pressure gradient increases. When dynamic obstruction is present, the flow profile is dagger shaped during acceleration. This late-peaking velocity is a reflection of the reduction in outflow tract size as the septum contracts secondary to muscular obstruction or systolic anterior motion.
AO flow profile in SAS
Severe SAS
Rounded profile
No longer rapid acceleration
Dynamic component
Late peaking flow
Figure 10.21 Mild aortic stenosis is present in this dog with a flow velocity of 332 cm/sec and a pressure gradient of 44. The flow profile remains very normal in shape when mild obstruction is present.

Figure 10.22 (A) As aortic stenosis becomes more severe the Doppler flow profile changes from its normal shape. Peak velocity is reached closer to mid systole, and its shape is more symmetrical. The start of ejection coincides with the latter part of the QRS complex. (B) Mitral insufficiency jets may be recorded by mistake when trying to obtain aortic flow velocities. Mitral regurgitant jets typically start early in systole near the onset of the QRS and end later than aortic flow, well beyond the T wave. The velocity of the mitral regurgitant jet can be used to validate the pressure gradient obtained across the aortic stenosis. See text for details.

Take care to record outflow tract and aortic flow and not mitral regurgitant flow when trying to obtain velocities for pressure gradients. Color-flow Doppler helps localize the turbulent jet, but patient movement, respiratory movement, and motion of the heart itself can complicate matters, and a mitral regurgitant jet may inadvertently be recorded instead of outflow velocity. Mitral regurgitation typically will start early in the systolic time period, and flow starts near the onset of the QRS complex. Left ventricular outflow and aortic flow typically will start later in systole coinciding with the latter part of the QRS complex (Figure 10.22). Mitral regurgitant flow also lasts longer and extends well beyond the T wave since insufficiencies typically last into the isovolumic relaxation phase of diastole (Figure 10.22) (17,55). This mistake is made more often when a nonimaging Doppler probe is used.
When mitral insufficiency is present, the pressure gradient of the regurgitant jet should be used, if possible, to confirm the pressure gradient obtained across the stenosis (Figure 10.22). A gradient across an aortic stenosis of 100 mm Hg in a patient with a systolic blood pressure of 120 mm Hg indicates left ventricular pressure of at least 220 mm Hg, and the velocity of mitral regurgitation should reflect this pressure and be approximately 7 meters per second (4 × 72 = 196). This assumes that left atrial enlargement is minimal and atrial pressure is normal at less than 10 mm Hg.

Aortic stenosis with a pressure gradient of less than 50 mm is considered mild in severity, and the animal may never show any clinical signs related to the disease. Pressure gradients between 50 and 80 to 90 mm Hg represent moderate obstruction to outflow, while gradients higher than this imply severe stenosis and carry a poorer prognosis for the animal (2,6,15,54).
SAS severity based on PG
<50 mm Hg = mild
>50 but <80–90 = moderate >80–90 = severe
There is controversy as to what velocity must be exceeded before the diagnosis of aortic stenosis can be made. The published reference ranges for normal aortic flow velocity range from .65–2.65 depending upon the study (15,21,26,29,30,51,56–61). These studies vary with regard to transducer location, sedation, and the use of angle correction. Velocity values defining aortic stenosis range from >1.70 m/sec to >2.50 m/sec (15,26,51). There is general agreement that velocities exceeding 250 cm/sec are consistent with the presence of aortic stenosis. Velocities >200 cm/sec are uncommon in dogs but may be seen in athletic animals or animals with slow heart rates, and a definitive decision that the animal in question is free from stenosis when flow velocities fall between 200 and 250 cm/sec is typically not made. Velocities <200 cm/sec are usually considered to be normal, but some cardiologists consider velocity >1.7 to be abnormal (2,15,26,51,62).
Subvalvular aortic stenosis is a progressive disease and severity may increase until the animal is full grown. A normal pressure gradient at several weeks of age or a mild pressure gradient at a young age therefore does not represent the absence of disease or the presence of insignificant obstruction, as the disease may still progress to a severe level (22).
The pressure gradient obtained from Doppler echocardiography is affected by stroke volume. Flow through the aorta and the size of the aortic orifice are important (26,51,55). A repeat study where gradients are lower may just indicate poorer flow through the aorta secondary to myocardial failure or more significant mitral insufficiency resulting in lower forward flow. The velocity of flow is also affected by aortic insufficiency since the regurgitant volume is involved in the aortic flow velocity (Figure 10.23). Mild aortic insufficiencies will probably not affect the gradient to any great degree, but the moderate to severe regurgitations that are sometimes present will overestimate the severity of the actual physical obstruction. The same applies to any other cardiac defect that adds volume to flow through the aorta (2). Do not base the diagnosis of aortic stenosis on high velocity aortic flow alone. Patent ductus arteriosus may be found in conjunction with aortic stenosis, and the severity of the stenosis cannot be accurately determined until the ductus has been closed.
PG affected by
Low output
Myocardial failure
Decreases PG
Increased stroke volume
AI, PDA
Increases PG
Figure 10.23 Aortic insufficiency is present in most dogs with subvalvular aortic stenosis. Here a Doppler signal indicates the presence of aortic insufficiency (arrow). The volume associated with the regurgitation can elevate systolic flow velocity and the calculated pressure gradient.

Pulmonary Stenosis
Pulmonary stenosis occurs with high incidence in the Bullmastiff, Beagle, bulldog, Boxer, spaniel, Keeshond, Schnauzer, Chihuahua, and terrier breeds (4,22,55,63–68). English Bulldogs are reported as the most common breed to have pulmonary stenosis (69). Tidholm found that the overall incidence of pulmonary stenosis in one retrospective study of 151 dogs with congenital heart disease was 20% (4). It has been reported in the cat as well (13,70–72). Pulmonary stenosis is typically valvular, but fixed subvalvular constriction may occur by itself or in conjunction with the valvular stenosis. Subvalvular obstruction as a dynamic component may also develop secondary to compensatory hypertrophy. Supravalvular stenosis rarely occurs (23,64,65,67,70). Even rarer is pulmonary stenosis that involves the branches of the pulmonary artery (72). Valvular and subvalvular pulmonary stenosis usually develop to their peak pressure gradient early in life and do not increase in severity as the animal matures as subaortic stenosis does (15).
Two-Dimensional Evaluation
Four different views are available to image the pulmonary valves and artery: the right parasternal transverse and oblique views, and the left cranial long axis and transverse pulmonary artery views. The site for the clearest valvular image varies from animal to animal, and all should be used in evaluating dogs with pulmonary stenosis. The features of pulmonary stenosis include right ventricular hypertrophy, abnormal pulmonary valves or outflow tract, poststenotic dilation of the main pulmonary artery segment, and possible right atrial and right ventricular dilation (4,15,16,64,65,67,69).
There are two types of valvular pulmonic stenosis; usually both are referred to as dysplasia of the cusps (15,65,69). One involves thick immobile cusps; the other involves fusion of the peripheral edges of the semilunar valves (16,69). Type 1 (or A) is typified by commissural fusion. The semilunar cusps have not separated completely resulting in doming of the valves (Figure 10.24). This means that the body of the valvulae curve toward the walls of the pulmonary artery as flow pushes them to the side during systole while the edges of the cusps remain in the center of the artery and stay in close approximation to each other throughout the cardiac cycle. Freeze-frame imaging of the leaflets show that the leaflets do not move toward the wall of the artery, as they normally would, creating a
hammock-like appearance of the valves within the pulmonary artery during systole. The severity of stenosis is related to the degree of commissural fusion. The cusps show little if any thickening, a normal annular size, and a post stenotic dilation. When Type 2 (or B) valvular dysplasia is present, the cusps will appear visibly thickened and immobile, there may be hypoplasia of the annulus and cusps, and at times, a subvalvular ring may be present (4,15,20,23,67,69,73–76) (Figure 10.25). The two forms are not mutually exclusive, and thick immobile cusps can coexist with commissural fusion (19,65).
Type I PS
Commissural fusion
Type II
Valvular dysplasia
Hypoplastic annulus
Not mutually exclusive
Figure 10.24 (A) Doming of the pulmonary valve cusps (arrows) is seen when commissural fusion is the cause of the pulmonary stenosis. The cusps do not move toward the walls of the pulmonary artery during systole. This is a zoomed image of the valve. (B) During diastole the cusps often billow toward the outflow tract (arrow). A poststenotic dilation is seen as well as right ventricular hypertrophy.
Plane = right parasternal transverse heart base, RVOT = right ventricular outflow tract, PA = pulmonary artery, RMPA = right main pulmonary artery, RA = right atrium, AO = aorta, RVW = right ventricular wall.

Figure 10.25 (A) Valvular dysplasia is the cause of pulmonary stenosis in this dog. The valve leaflets are thick and echodense (arrow). This is the extent of valve motion toward the walls of the pulmonary artery. (B) The dysplastic pulmonary valve in this dog is thick (arrow), and there is asymmetry between the cusps. (C) Hypoplasia of the pulmonary annuls is present in this animal with pulmonic stenosis. The diameter of the artery is much smaller than the aorta. Planes = right parasternal transverse heart base, RV = right ventricle, RA = right atrium, AO = aorta, PA = pulmonary artery, RMPA = right main pulmonary artery, LMPA = left main pulmonary artery.

Infundibular hypertrophy may be part of the congenital lesion or may appear as a secondary change after concentric hypertrophy develops. The vast majority (96%) of dogs in a study that included 29

animals had subvalvular hypertrophy (4,64,67). Increased muscle thickness is seen within the right ventricular outflow tract (Figure 10.26). This is best seen on right or left parasternal transverse views. Color-flow Doppler can define the narrow outflow tract.
Color-flow Doppler helps define infundibular stenosis.
Figure 10.26 The lateral wall of the right ventricular outflow tract is hypertrophied creating a narrow probably dynamic outflow obstruction (arrow). Plane = right parasternal transverse heart base, RA = right atrium, RVW = right ventricular hypertrophy, PV = pulmonary valve, PA = pulmonary artery, AO = aorta.
A hypoplastic pulmonary artery or annulus is recognized by comparing the diameter of the pulmonary artery at the level of the valve to the diameter of the aorta. A ratio of pulmonary artery to aorta is .80–1.15 in normal canine hearts (68,77). The aortic diameter is measured from the right parasternal long-axis outflow view, and the pulmonary artery annulus is measured on right or left parasternal transverse views. The diameter is measured at cusp insertion (69). Supravalvular stenosis is rare (15).
PA : AO
Normal = .85 − 1.15
The poststenotic dilation seen with pulmonary stenosis is best appreciated on right or left parasternal transverse views of the pulmonary artery. The pulmonary artery will become wider distal to the valve (4). This is different from the pulmonary artery dilation seen with pulmonary hypertension, patent ductus arteriosus, or other volume overloading of the artery. The width of the artery at the level of the stenotic pulmonary valve will be normal or smaller than normal if the annulus is hypoplastic. The dilation occurs beyond the valves (Figure 10.25c). With volume overload or pulmonary hypertension, the artery will be dilated at the level of the valve and usually remain dilated to the same degree distal to the valve. The dilated pulmonary artery segment may be seen as a prominent circular structure on right parasternal long-axis views below the aorta at the base of the left atrium (Figure 10.27). The degree of pulmonary artery dilation does not appear to correlate with the

severity of the obstruction (23).
Dilation of PA
Poststenotic
Valve diameter normal or small
Dilation distal to valve
Pulmonary hypertension or shunt
Figure 10.27 The dilation of the pulmonary artery segment may be seen as a prominent circular structure on right parasternal long-axis views at the base of the left atrium. Plane = right parasternal long axis outflow view. RVW = right ventricular wall, RV = right ventricle, LV = left ventricle, LA = left atrium, AO = aorta, PA = pulmonary artery.
The afterload created by the obstruction to flow causes the right ventricular wall and interventricular septum to hypertrophy (4). Severe septal hypertrophy may contribute to dynamic outflow obstruction in both the right and left ventricular chambers. The hypertrophy is concentric, and a small ventricular chamber is seen (Figure 10.28). Increases in chamber size suggests that significant tricuspid or pulmonary insufficiencies are present or possibly a shunt coexists with the pulmonary stenosis. The elevated systolic pressure causes flattening of the septum, and paradoxical septal motion may be seen (Figures 6.4, 6.5). The paradoxical motion that occurs during systole is typically subtle unless the volume overload is significant in which case diastolic flattening is seen as well (33,64,67).
Figure 10.28 Concentric right ventricular hypertrophy develops secondary to the increased afterload created by pulmonary stenosis. The right ventricular wall is thick (arrow) and the chamber is small. The left ventricular chamber is also small secondary to decreased preload when stenosis is moderate to severe. Plane = right parasternal four-chamber view, RA = right atrium, LV = left ventricle, LA = left atrium.

Right atrial dilation is reported in dogs and cats with pulmonary stenosis (64,72). This may be secondary to diastolic or systolic dysfunction, or it may be secondary to tricuspid insufficiency caused by concurrent dysplasia (Figure 10.29) (23,33). Almost 50% of dogs with pulmonary stenosis have some degree of tricuspid insufficiency (23,33).
Figure 10.29 Right atrial enlargement may be seen when tricuspid insufficiency or ventricular dysfunction is present in hearts with pulmonary stenosis. The right ventricular wall (arrow) is severely hypertrophied, and the left ventricular chamber appears concentrically hypertrophied. Plane = right parasternal long-axis four-chamber view, RV = right ventricle, RA = right atrium, LV = left ventricle, LA = left atrium.
When the pulmonary stenosis is moderate to severe, there will be a decrease in left ventricular chamber size secondary to decreased right ventricular cardiac output. The left ventricular chamber will appear to be concentrically hypertrophied (Figures 10.28, 10.29). Left ventricular wall and septal thicknesses will be higher than normal, and chamber size will be small. This is pseudo-hypertrophy

since it is a preload-related change with lack of stretch on the cardiac muscle fibers. The interventricular septum will bow down toward the left ventricular chamber since right-sided pressure will exceed left-sided pressure, and paradoxical septal motion may be present. The left atrium will also be smaller than expected.
LVH seen with PS
Pseudo hypertrophy
Secondary to poor preload
May cause SAM
Systolic anterior mitral (SAM) valve motion may be seen in patients with elevated right ventricular pressure caused by pulmonic stenosis, Tetralogy of Fallot, and pulmonary hypertension. All of these disease processes may result in left ventricular volume contraction, and the abnormal left ventricular geometry is thought to be the cause of the SAM. Even when flow velocity is normal, the flow profile shows late-peaking velocity secondary to the SAM (78).
Bulldogs and Boxers with pulmonary stenosis may have abnormal coronary arteries (79–82). A single right coronary artery is found that divides into two branches shortly after leaving the right coronary ostium. One branch supplies blood to the right ventricle as usual, while the other supplies blood to the left ventricle via an aberrant pathway. The pathway this aberrant vessel takes may be cranial to the pulmonary artery, between the pulmonary artery and aorta, or caudal to the aorta (Figures 10.30, 10.31). Identification of a normal left coronary artery is important when balloon valvuloplasty or a patch graft procedure is considered since these procedures may cause rupture of the aberrant artery or ischemia and possible infarct within the left ventricular chamber (69,79,80,82). The aberrant coronary artery may constrict the pulmonary valve annulus or the subvalvular area creating a stenosis that leads to right ventricular hypertrophy with growth and maturation of the dog (80,81). When this occurs, color-flow Doppler will show the turbulence associated with the obstruction begin at the level of the aberrant artery, not the valve. One imaging plane to see the normal left coronary artery on is a right parasternal transverse view at the level of the aortic valve, left atrium, left auricle, and pulmonic valve (Figure 10.32). Looking at the junction between the left auricular appendage and the pulmonary artery, fan the crystals up toward the pulmonary valve and down away from it. The normal left coronary artery is seen exiting the left coronary ostium and coursing through the muscle just above the auricular appendage and just below the pulmonary valve. Be sure to identify the coronary artery as it leaves the aorta because the space between the auricle and right ventricular wall can mimic the artery. A blind end or blunted ostium at the location of a normal coronary artery can be present when there is a single right coronary artery, so it is imperative that the left coronary artery is seen completely crossing over the pulmonary artery after it leaves the aorta. Cranial left transverse images of the aorta and pulmonary artery may also show the normal left coronary artery. Fan the transducer cranial and caudal while viewing the pulmonary artery and the coronary vessel is seen leaving the aorta, crossing under the pulmonary valve to the right side of the sector image (Figure 10.33). Right parasternal long-axis images of the left ventricular outflow tract also provide a window to the normal left coronary artery. Fan the transducer between a good inflow outflow view and one with just the outflow tract. The normal coronary artery is seen leaving the aorta and running through the myocardium toward the left ventricular chamber.
Aberrant left coronary artery
Primarily seen in bulldogs

May create constriction and stenosis
Figure 10.30 Normal coronary artery anatomy is shown in the upper image. Diagrams of the various anatomical pathways of a single right coronary artery are show in the lower images. The aorta is central and contains three semilunar valve leaflets. The pulmonary artery is the circle to the bottom and right of the aorta. Form R2A is most common in the dog. RCA = right coronary artery, LCD = left cranial descending artery, LCx = left circumflex artery, PT = pulmonary trunk.
Reprinted with permission of Boucek RJ, Morales AR, Romanelli R, Judkins MP. Coronary Artery Disease: Pathologic and Clinical Assessment. Williams and Wilkins, Baltimore, 1984, p 57.
Figure 10.31 Bulldogs and Boxers with pulmonary stenosis may have abnormal coronary arteries. A single right coronary artery divides into two branches shortly after leaving the right coronary ostium. One branch supplies blood to the left ventricle via an aberrant pathway. The pathway this aberrant vessel takes may be proximal to the pulmonary artery, between the pulmonary artery and aorta, or caudal to the aorta. Here an aberrant coronary artery (arrow) is identified superior to the pulmonary valve on a transverse image of the pulmonary artery. RA = right atrium, RV = right ventricle, AO = aorta, PV = pulmonary valve, PA = pulmonary artery.

Figure 10.32 The normal left coronary artery exits the left coronary ostium coursing through the muscle just above the left auricular appendage and just below the pulmonary valve. Be sure to visualize the left coronary artery leaving the aorta and completely crossing over the pulmonary artery (arrows) after it leaves the aorta. Plane = right parasternal transverse heart base, RV = right ventricle, RA = right atrium, AO = aorta, LA = left atrium.
Figure 10.33 The normal left coronary artery leaves the aorta, crossing distal to the pulmonary valve to the right side of the sector image on left cranial transverse views (arrows). Here the artery branches almost immediately. PV = pulmonary valve, RV = right ventricle, AO = aorta, LA = left atrium, LCA = left coronary artery.
Spectral Doppler Evaluation
Spectral Doppler of the pulmonary stenosis will show high velocity flow (Figure 10.34) (53,54). Use whatever view provides the highest flow velocities. On right parasternal transverse views, the pulmonary artery is typically curved away from the Doppler cursor, so use the modified long-axis

view of the left ventricle and pulmonary artery to provide parallel alignment with flow. Left cranial longor short-axis views may also provide good alignment with flow (15).
Figure 10.34 High velocity flow is recorded within the pulmonary outflow tract or across the valves when pulmonic stenosis exists. Here velocities of 494 cm/sec are consistent with a pressure gradient of 97 mm Hg and severe stenosis.
A pulsed-wave gate can be placed within the outflow tract in order to determine whether any subvalvular obstruction is present if two-dimensional images are inconclusive. There will be a step up in velocity if an obstruction is present as the gate is moved from the subvalvular area to the valve. Normal pulmonary artery flow is typically less than 130 cm/sec, but there are reports of normal flow up to 191 cm/sec in the dog. The assessment of severity is similar to that used in aortic stenosis. A gradient of less than 50 mm Hg is considered mild. Gradients between 51 mm Hg and about 75 mm Hg are moderate in severity, and gradients higher than that are associated with severe pulmonary stenosis (15,54,83). More severe stenosis has a higher mortality rate (23). When dynamic outflow obstruction exists, a dagger-shaped flow profile similar to that found in dynamic subaortic stenosis and hypertrophic cardiomyopathy is seen.
PS severity based on PG
<50 mm Hg = mild
>50 mm Hg but <75 mm Hg = moderate >75 mm Hg = severe
When tricuspid insufficiency is present, the regurgitant jet should be interrogated with a Doppler beam to help confirm the pressure gradient obtained across the pulmonary valve (Figure 10.35). A tricuspid regurgitant jet may also be used to derive the only pressure gradient if difficulty is encountered getting a pulmonary flow velocity. A tricuspid regurgitant jet with velocities of 4.33 cm/sec for instance signifies that right ventricular systolic pressures are at least 75 mm Hg (4 × 4.332). If pulmonary artery pressure is close to normal at around 20 mm Hg, then a pressure gradient of 55 mm Hg can be applied to the pulmonary stenosis (right ventricular pressure is 55 higher than the
pulmonary artery pressure of 20).
Figure 10.35 The velocity of a tricuspid regurgitant jet can be used to confirm or derive the pressure gradient across the pulmonary artery when pulmonic stenosis is present. Here right ventricular pressures are at least 75 mm Hg based upon the tricuspid regurgitant jet velocity. If pulmonary artery pressures are normal at about 20 mm Hg, the pressure gradient across the stenosis must be close to 55 mm Hg.
A measurement of diastolic antegrade flow through the stenosis has been used to assess significance of main pulmonary artery stenosis (supravalvular stenosis) in cats with normal pulmonary valve anatomy. Diastolic antegrade flow through the stenosis is graded based upon how long it persists. The start of diastole in this study was defined as the end of the T wave. No diastolic regurgitant flow is a grade of 0, grade 1 has diastolic flow that occurred through 50% or less of the diastolic time period, diastolic flow that occurs throughout more than 50% but less than 100% of the diastolic time period is a grade 2, and flow that persists thorough diastole is a grade 3 (72).
The pressure half-time of the diastolic regurgitant flow has also been analyzed in these same cats with main pulmonary artery stenosis and normal pulmonary valves. This measures the time of diastolic decay (slope) from the peak velocity at the beginning of diastole (end of the T wave) to the beginning of systole or the baseline if flow was less than grade 3. Both of these measurements, pressure half-time and grade of diastolic antegrade flow correlate well with the severity of the pulmonary stenosis and has better separation between moderate and severe disease than systolic or diastolic pressure gradient did when compared to two-dimensional changes and clinical signs. Either a diastolic pressure half-time of antegrade flow through the stenosis of >100 msec or a diastolic antegrade flow time of grade 3 was consistent with severe pulmonary stenosis in these cats (84). This method of determining severity has been used in human studies in the assessment of aortic coarctation (72,85,86).
Color-Flow Doppler Evaluation
Color-flow Doppler helps define the extent of obstruction. The mosaic pattern associated with

turbulence and high velocity will start at the level of the valve when valvular obstruction is present. The outflow tract will be defined by the aliased color-flow signal when either fixed or dynamic subvalvular obstruction is present. The width of the outflow tract and the valvular orifice are well defined with color but usually overestimate the size of the stenotic area. When color-flow Doppler is available, use it to help align the spectral Doppler beam properly.
The pulmonary artery stenosis diameter to pulmonary artery valve diameter has been used to assess severity of artery stenosis and clinical significance in cats (72). These cats had normal pulmonary valve anatomy and stenosis within the artery or its branches. The measurements are made at the largest diameter (vena contracta) of the stenosis and at the pulmonary valve on right or left parasternal transverse imaging planes of the pulmonary artery. The vena contracta is defined by color-flow Doppler as the largest area through which blood flows at the level of the stenosis. This ratio is used to determine severity of the stenosis; the smaller the ratio the more severe the stenosis was felt to be (72). Cats with obstruction to flow of greater than 60 mm Hg had vena contracta diameter to pulmonary valve diameter ratios of <.30 (72).
As with aortic stenosis, volume through the pulmonary artery affects the derived pressure gradient. Any shunt that adds volume or the presence of significant pulmonic insufficiency adds volume and velocity to the pulmonary artery flow profile (Figure 10.36). The pressure gradient will not truly reflect the degree of physical obstruction.
Figure 10.36 Pulmonic insufficiency and stenosis are recorded on this Doppler tracing. Significant pulmonic insufficiency will elevate the derived pressure gradient.
Double-Chamber Right Ventricle and Infundibular Stenosis
The crista supraventricularis is the smooth muscular portion of the right ventricular chamber that separates the tricuspid valve from the pulmonary artery (87–92). It can be seen on transverse views of the heart base above the aorta between the tips of the tricuspid valve and the pulmonary valve. A stenosis in this area of the right ventricle separates the chamber into two sections, a high pressure proximal chamber and a low pressure distal chamber between the obstructive lesion and the pulmonary valve (84,87–92). The obstruction can be created by a fibrous or fibromuscular ridge of

tissue, a muscular bundle, or both, which extends across the right ventricular chamber at the level of or close to the supraventricularis (87–92). This obstruction creates an orifice of variable size for flow between the high pressure and low pressure portions of the right ventricular chamber (91). There is confusion regarding the terminology used to name this defect. Names include infundibular obstruction, midventricular obstruction, or a double-chambered right ventricle (DCRV), but they all create the same pathophysiologic changes within the heart as valvular pulmonary stenosis does. Midventricular obstruction or double-chambered right ventricle are typically described as more muscular in nature and occur at the junction of the supraventricularis and the right ventricular outflow tract, while infundibular obstruction is usually described as a discrete fibrous band located proximal to the pulmonic valve. All of these are often associated with other congenital defects including ventricular septal defect, atrial septal defect, tricuspid dysplasia, pulmonic valvular stenosis, and subaortic stenosis. The high pressure within the proximal chamber can create significant tricuspid insufficiency even without the presence of structural tricuspid valve disease (91). There appears to be a propensity for this congenital defect in Golden retrievers, Boxers, and Siberian Huskies (91,93).
Midventricular stenosis or DCRV
Found at junction of RV and supraventricularis
Subvalvular or infundibular stenosis
Closer to PV in RVOT
Two-Dimensional and Doppler Evaluation
The obstruction is identified on echocardiographic images from slightly oblique right or left parasternal transverse views of the heart base or on modified (foreshortened) left apical views of the right ventricular chamber (Figures 10.37, 10.38). Identification of turbulent flow within the right ventricular chamber proximal to the right ventricular outflow tract should prompt angling of the transducer into nonstandard imaging planes in order to identify the source of the abnormal flow (Figures 10.39, 10.40). A turbulent jet within the right ventricular chamber, distinct fibromuscular, or muscular tissue at the level of the turbulent flow, and hypertrophy of the right ventricular wall proximal to the obstructive lesion, which is absent distal to the muscular bundle, and turbulent flow are identifying features of this form of right ventricular obstruction to outflow.
Features:
Midventricular Obstruction or DCRV
Fibromuscular band in RV
Abrupt cessation of RVH in RV
Turbulent color flow in mid RV
Figure 10.37 This obstruction is created by a muscular bundle (arrow), which extends across the right ventricular chamber at the level of or close to the supraventricularis. This defect splits the right ventricle into a high and a low pressure chamber and is called a double chamber right ventricle. Notice the hypertrophy in the high pressure chamber. Plane = right parasternal oblique transverse left ventricle, RV = right ventricle, PV = pulmonary valve, PA = pulmonary artery, LV = left ventricle, RVW = right ventricular wall.

Figure 10.38 This obstruction is created by a fibromuscular bundle (arrow), which extends across the right ventricular chamber at the level of or close to the supraventricularis. Plane = left parasternal transverse heart base, RV = right ventricle, PV = pulmonary valve, PA = pulmonary artery, RA = right atrium, RVW = right ventricular wall, AO = aorta.
Figure 10.39 Color-flow Doppler shows where the right ventricular chamber is narrowed (arrow) secondary to the fibromuscular obstruction shown in Figure 10.38. Plane = left parasternal transverse heart base, PV = pulmonary valve, PA = pulmonary artery, RA = right atrium, RVW = right ventricular wall, AO = aorta.
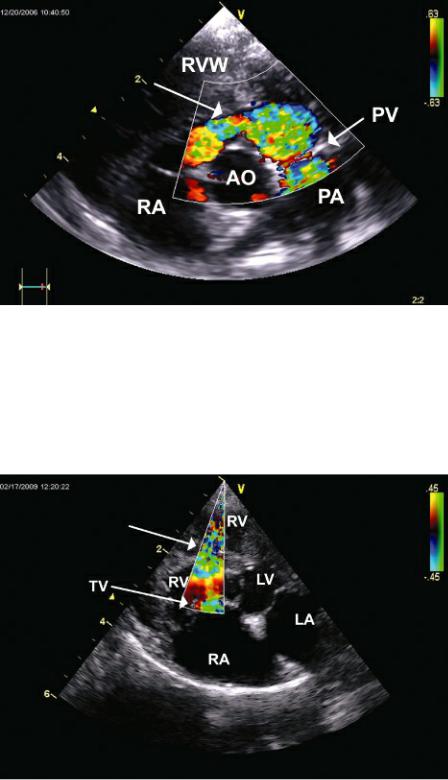
Figure 10.40 Color-flow Doppler shows turbulent flow with flow acceleration (arrow) at the level of a mid right ventricular obstruction to flow. The portion of the right ventricle between the obstruction and the tricuspid valve is the high pressure portion of the chamber. Plane = modified (foreshortened) apical four-chamber view, RV = right ventricle, LV = left ventricle, LA = left atrium, RA = right atrium, TV = tricuspid valve.
Flow through the obstruction is usually somewhat perpendicular to the Doppler beam on transverse imaging planes, and manipulation of the imaging plane in order to align the beam with the high velocity jet is required. This can be done by twisting away from standard transverse planes toward the long axis on the right or left and using color flow to help align the obstruction and turbulent flow with the Doppler beam. Another successful imaging plane is a foreshortened apical four-chamber view, one that is usually somewhere between a true apical position and a cranial transverse view. Spectral flow of the stenosis from this imaging plane will be in an upward direction on the display (Figure 10.40) (91,93). In cases where good alignment with the obstruction is not possible, tricuspid regurgitant flow can be used to determine the pressure gradient between the high pressure proximal chamber and the right atrium (91,93). This provides some idea of severity. For example, if the tricuspid regurgitant jet