


Analyzing Your
System
id you ever wonder how fast your computer actually is? Sure, it says Dthat it is a Pentium 2.8 Ghz on the box the system came in but the
speed of the CPU is not the only factor in determining how fast your system actually is. The true speed of your computer is determined by the speed of all of your hardware, such as the speed of data written and read from the hard drive, the speed of the RAM, and the speed of the front side bus of the motherboard. This chapter will help you analyze your system to determine exactly how fast it is and how you can make it faster.
Before you start to make your computer run faster, you need to understand the limitations of your hardware and also to be able to identify possible bottlenecks in your system. The situation is just like what would happen before you go to the hospital to have an operation. It is usually better to have some tests completed first so that the doctors know exactly what to do. Using the tools discussed in this chapter, you will be able to run different tests that will help you in the upcoming chapters decide which hacks will work best for your computer.
Monitoring Your System Hardware
Monitoring the status of the system using various tools will help you understand what is going on behind the scenes, much like monitoring the instrument panel on your car will help you understand what is happening to the vehicle at all times. For example, regular monitoring will reveal if you are running low on memory, if your CPU is overloaded, or if your system has too many programs running at the same time. These are all useful and important things to know, and having that information available will enable you to check your system’s operation and change settings to get optimal performance. There is a variety of performance monitoring software available on the market. However, Windows has many great monitoring applications built in that provide adequate reporting to analyze your system.
Using performance
Built into Windows is a great little tool called the Performance system monitor. The system monitor is a sleek tool that will allow you to easily
chapter
in this chapter
Using the Performance Monitor
Using Bootvis to Analyze Your System Start
Using the Task Manager
Benchmarking Your System

160 Part II — Increasing Your System’s Performance
monitor hundreds of different statistics about all areas of the operating system. Similar to other system monitor tools, its purpose is to help you detect problems and improve your system performance. The easiest way to start the performance application is by the command line or by using the Run command in the Start Menu. To start the performance application:
1.Click the Start Menu and select Run.
2.Then type perfmon.msc in the text box and click the OK button.
An icon for the application can be found in the Administrative Tools folder located in Control Panel. But for most users, running the preceding command will be the easiest method of starting the program.
 The Performance application gets the data for its performance counters from the System Registry. If you would like to change the source of the data so that it will get the data directly from the Windows Management Interface instead, simply start the performance counter with the “/sysmon_wmi” flag. Then type perfmon.msc /sysmon_wmi in the text box on the Run dialog box.
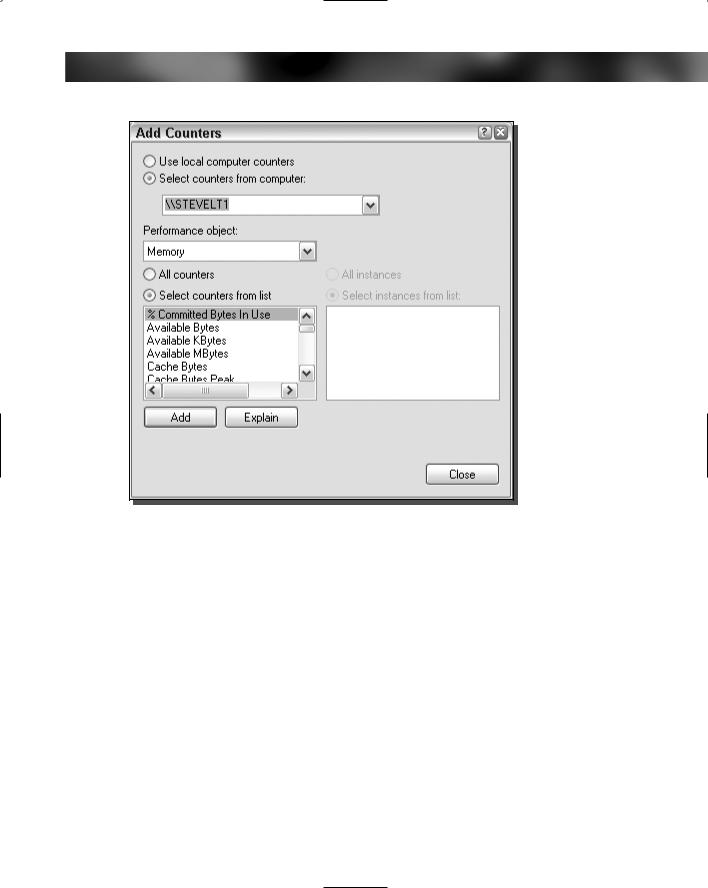
Once the program is started, you will be greeted with a graph of data as well as a list of active counters. You will see a graph of the % Processor Time as well as memory Pages/sec and the avg. Disk Queue Length. These are all great stats, but the Performance application has quite a few more from which to choose. In order to add more performance counters, simply click the icon with the symbol on it or press Ctrl I and the Add Counters window will appear, as shown in Figure 7-1.
Once the Add Counters window is shown, you will notice where it states “Performance Object.” In the drop-down menu list box below this is a list of all of the possible items that you are able to monitor. Depending on the services that your computer has installed, such as the Web server IIS, you will have more or less items available. Take a few minutes to browse through the list. You will notice that when you select a different item subject, you will be shown a new list of detailed counters in the box below. You have the option to add all counters or you can select only specific counters from the box by pressing the Ctrl key to select multiple items. Additionally, to the right of the listing box is another box which lists the instance of the object you are going to monitor. This gives you the ability to define the scope of the counter so that you can monitor only one specific device instead of monitoring all devices. For example, it is possible to monitor the queue length of just one hard drive instead of the total file access queue length.
Once you are finished selecting all of your counters for a specific object, click the Add button. Once you are finished adding counters for all of the objects you are interested in, click the Close button.
Viewing the data
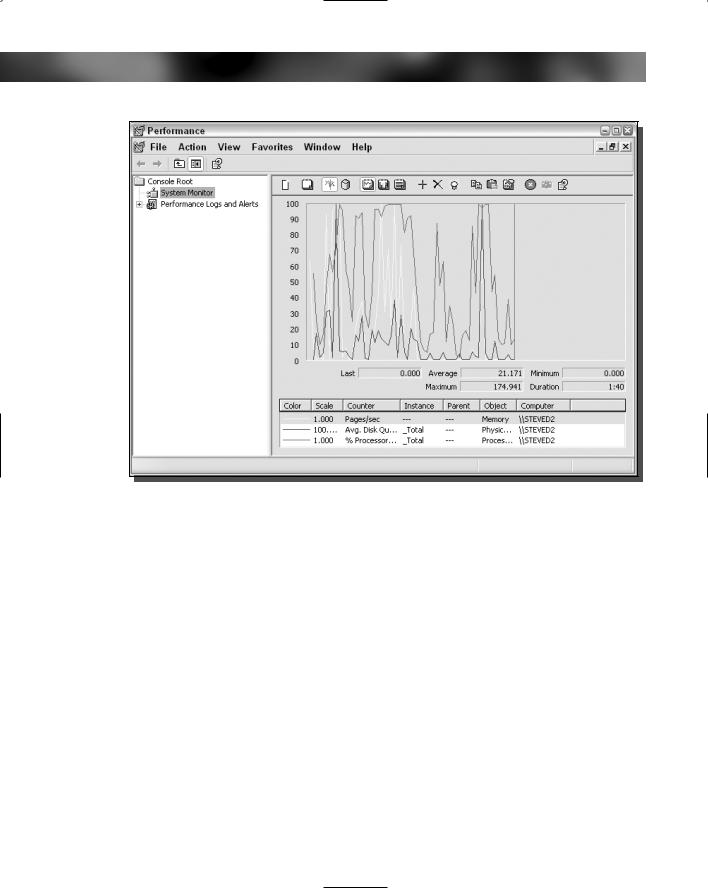
The performance counter allows you to view the data in many different ways. The default screen is the line graph, as shown in Figure 7-2. This display method is adequate for a few performance counters, but when you have more than three or four, figuring out what line is for what counter starts to become a little confusing. Fortunately, the employees at Microsoft
Chapter 7 — Analyzing Your System 161
FIGURE 7-1: Add Counters window listing all available items to monitor.
that made the performance counter application provided us with two other methods of viewing the data.
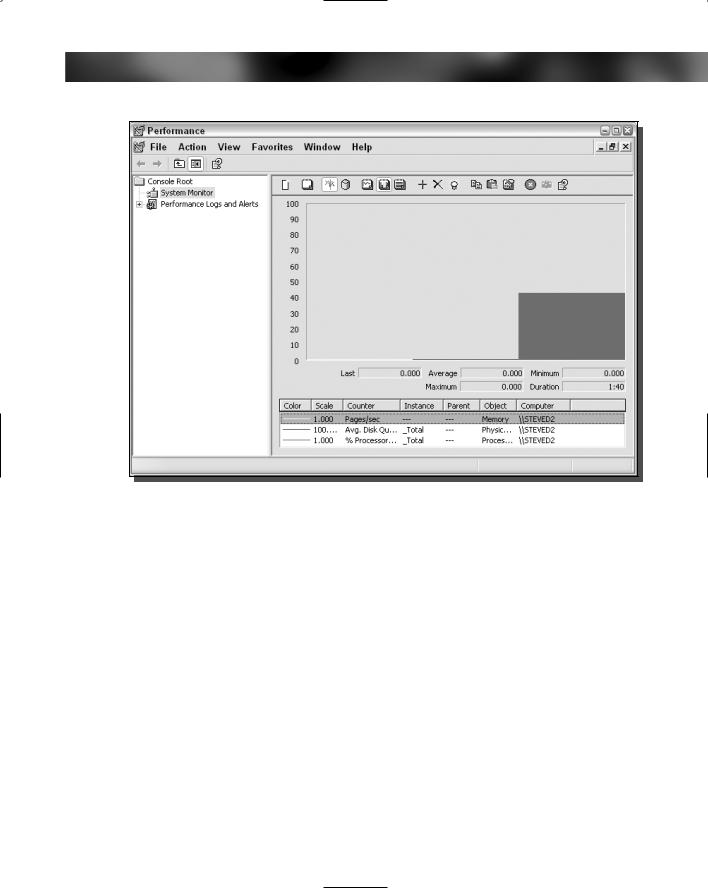
Another method of viewing the data is by using the histogram display, as shown in Figure 7-3. To change to this display method, simply press the Histogram icon on the menu or, on the keyboard, press Ctrl B. This method of displaying the data is not much better than the default. But because it relies on one scale, counters that report small numbers will be dwarfed by the counters that report large numbers. This limitation makes it almost impossible to read some of the counters.
To make everyone happy, there is also a Report viewing method which simply lists the counter numbers in text, as shown in Figure 7-4. Activate this viewing method by clicking the icon which looks like a notebook or pressing Ctrl R.
Setting update interval
Now that you have all of your counters set up and displaying data, you need to select the interval time of how often the data will be updated. How often you want the counters to be updated depends on your reason for monitoring your hardware. For example, if you are trying to
162 Part II — Increasing Your System’s Performance
FIGURE 7-2: Default screen of the Windows XP Performance counter.
track how much data your computer is sending through your network adapter every day or hour, it is not necessary to have that counter update every second. You will just be wasting CPU cycles because you are making the computer constantly update that counter. However, if you are interested in current memory or CPU utilization, you will want a much faster update time.
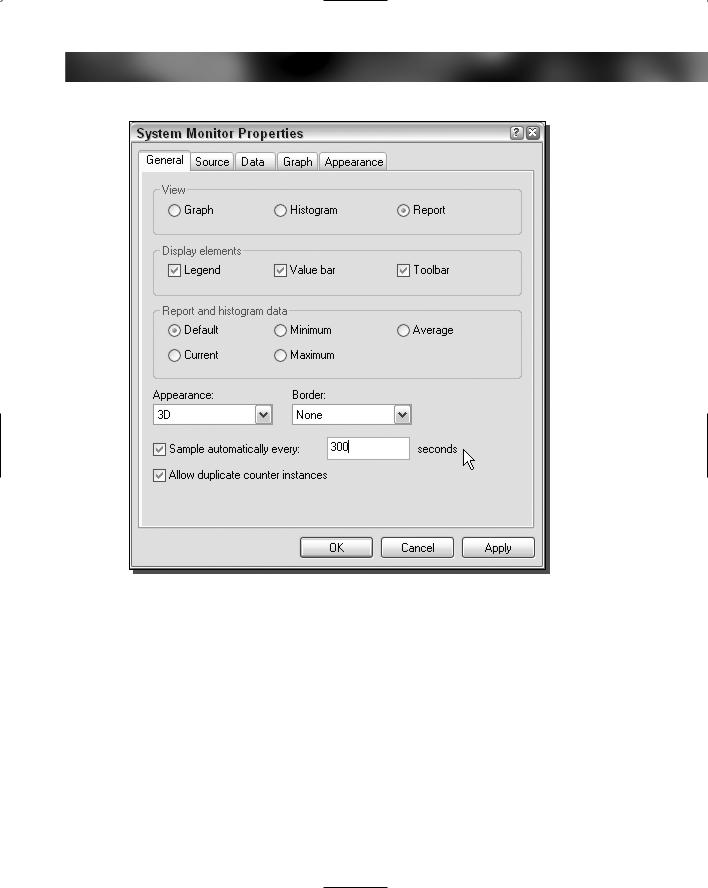
To change the update interval, click the Properties button, which looks like a hand pointing to a notebook. Alternatively, you can press Ctrl Q. Once the System Monitor Properties window loads, locate where it states, “Sample automatically every” and update the value in the text box, as shown in Figure 7-5.
Configuring alerts
If the hundreds of performance counters are not enough for you, Microsoft has also included the ability to set alerts that are fully customizable and can be set for any performance counter. In order to set up an alert for a specific performance counter:
1.Start the Performance application if it is not already started, then once it is started, expand the Performance Logs and Alerts item.
2.Next, click the Alerts item and you will see a list of active alerts set up on your system in the window on the right.
Chapter 7 — Analyzing Your System 163
FIGURE 7-3: Performance’s Histogram view.
3.Right-click in the open window on the right-hand side of the screen and select New Alert Settings.
4.Type a name for your new alert in the dialog box and click OK.
5.Next, on the alert settings page, click the Add button to add a performance counter to be monitored.
6.Once you have finished adding a performance counter, close the Add Counters window. Then, fill in the settings for the alert event trigger such, as the limit that will trigger the alert.
7.Also, take a look at the Sample Data Every section to set this area appropriately.
8.Click the Action tab to specify what you would like to be done when and if the alert is triggered.
9.Also, take a look at the Schedule tab to specify when the alert should be started and the duration of the alert.
10.Once you are satisfied with all of the settings, click the OK button and you are finished setting up an alert.

164 Part II — Increasing Your System’s Performance
FIGURE 7-4: Performance’s Report view.
At any time, it is possible to make changes to the alerts by right-clicking them and selecting Properties.
Analyzing and detecting problems
Use of the performance application and the various performance counters makes it possible to detect many problems and shed light on how to make your system run faster. You should familiarize yourself with a handful of tips that deal with specific performance counters; these will prove to be invaluable in your analysis and decision making. The following are some of the things to look out for when monitoring your system:
Physical Disk: Disk Read Bytes/sec & Disk Write Bytes/sec. These two performance counters can tell you if your physical disk is set up and functioning correctly. In order to determine this, consult the Web site or the manual of the manufacturer of your hard disk. Look up what the range of read/write speeds are. If the readings that you are getting are far below what you should be getting, then your hard disk could be damaged or set up incorrectly. Run diagnostic software on the disk and make sure that it is set up properly in device manager with the correct transfer mode. Remember that most hard drives read at different speeds when they are reading from different parts of the disk. This is why there may be some discrepancies between your readings.
Chapter 7 — Analyzing Your System 165
FIGURE 7-5: Updating the update interval value.
Paging File: % Usage & % Usage Peak. These two performance counters can tell you how well your system is using the page file. If you set the size of the page file manually, then these counters are very critical to deciding what size the page file should be. As a rule, if the page file % Usage is above 95 percent or if the Usage Peak is near 100 percent, consider increasing the size of the page file if you have set the size manually.
Memory: Available MBytes & Paging File: % Usage. These two performance counters will help you decide if you should put more RAM in your computer. If your available megabytes are under 5 and your paging file usage percentage is very high, then you should consider purchasing more RAM for your computer.
Processor: % Processor Time. This performance counter monitors the activity and work your processor is doing. If your CPU is consistently working at or above 85 percent, and you are not running any computation-intensive applications in the background,

166 Part II — Increasing Your System’s Performance
this would indicate that you should consider upgrading your CPU. The CPU is having a hard time keeping up with all of your programs. You could also try closing open applications that are running in the background to make your computer more responsive and faster.
Saving your performance counter setup
Once you have spent some time adding all of the performance counters that you would like to use, it is possible to save this configuration so that every time you start the performance application, your performance counters will automatically be loaded.
In order to save the performance counters selected:
1.Click the File menu object on the menu bar and select Save As.
2.Then type in a file name and specify a location and click Save.
This will save a new .MSC file that will have all of your performance counters saved in the file. The next time you want to load all of your performance counters, simply open up the new file that you saved by either double-clicking it or making a shortcut to it and placing it in your Start Menu. If you open up the performance application in the way that was shown earlier, you will not have your performance counters loaded automatically.
Using Bootvis to analyze your system start
Bootvis is an application released by Microsoft that allows users and developers to debug and detect issues that occur during the system start up. Contrary to what most people believe, Bootvis is not a performance enhancement tool, but a diagnostic and reporting tool. Running Bootvis will not speed up or change the performance of your system in any way other than what the system does automatically. Therefore, running Bootvis for the purpose of having it automatically speed up your system is pointless. However, the information that the Bootvis reports can be invaluable to improving the performance of your system.
What exactly is Bootvis? Bootvis is a tool that will trace all of the different stages of the system start such as the system kernel, then the device drivers, and then the start up of processes. If you are wondering why your computer is taking so long to start up, then Bootvis will provide you with many answers.
Installing Bootvis
Bootvis is not included with Windows and must be downloaded from the Web. Currently, Microsoft has removed the link to download the program from their Web site. According to the Web page at Microsoft at which the tool originally could have been downloaded
(/www.microsoft.com/whdc/hwdev/platform/performance/fastboot/bootvis
.mspx), “The Bootvis.exe tool is no longer available from this site.” Microsoft has never made a public statement explaining exactly why the utility was removed. Nevertheless, based on messages that I have read in Microsoft’s Windows XP newsgroups and other sites, this is what most users close to the issue believe:

Chapter 7 — Analyzing Your System 167
Microsoft has removed this tool from their site because users have been using it for the wrong purpose. Ever since the tool was first discovered on Microsoft’s Web site, users would use Bootvis because they thought that it would speed up their computer’s boot time. That misconception arose because Bootvis is capable of starting some of Windows XP’s boot optimization features that are normally run by the operating system after it has fully analyzed the boot. However, Bootvis was designed to be a performance analysis and diagnostic utility, not a speed boosting app. Because users were using Bootvis for the wrong reason, and because use of its advanced boot optimization features could possibly do more harm than good, Microsoft decided to remove the tool from their site.
Microsoft’s removal of the tool from their Web site is unfortunate, because it really can give you a lot of useful information about your boot. Fortunately, several Web sites exist from which users of Windows XP still download Bootvis, namely:
SoftPedia: www.softpedia.com/public/cat/12/2/12-2-1.shtml.
Major Geeks: www.majorgeeks.com/download.php?det 664
Old Microsoft Download Link (Still works but not listed on any page): http://download.microsoft.com:80/download/whistler/BTV/1.0/ WXP/EN-US/BootVis-Tool.exe
If the above links no longer work. Check out TweakXP.com and you will find more links from which you can download Bootvis.
The latest version of Bootvis that Microsoft released is version 1.3.37.0. This version is compatible with Windows XP Service Pack 1, but it is not known yet if it will work for Service Pack 2.
Once you have downloaded a copy of Bootvis, install it by double-clicking the file. A new entry will be made in the Start Menu under All Programs, labeled Microsoft Bootvis.
Tracing your system start
Now that you have Bootvis installed, you are ready to start analyzing your system. Start the application from the shortcut located in the Start Menu. Once the application has started, you will see an empty Bootvis interface. To initiate a new trace, click the Trace item on the menu bar and select Next Boot Driver Delays, as shown in Figure 7-6. This will pop up a new window, asking you how many times you would like the trace to be run. It is often a good idea to run the trace more than once to see if the items that are slow in your startup are consistently slow. Select the number of repetitions by using the arrow buttons. Once you click OK, your computer will automatically start the process of tracing and will reboot your computer.
Make sure that you do not have any unsaved work on your system, as you could lose anything that you have been working on if you do not save your work before the system restarts.
When you are ready, click the OK button and you will see a countdown window counting down from 10 seconds until the system will reboot. If you choose, you can click the Reboot Now button if you do not want to wait for your system to reboot automatically.
Once your system starts to reboot, it will start the tracing process. Do not press any buttons on your computer during the tracing process other than to log onto your computer, if your
168 Part II — Increasing Your System’s Performance
FIGURE 7-6: Initiating a new boot trace with Bootvis.
computer is set up that way. After the log on screen, Bootvis will display a message on the screen telling you not to do anything on your computer.
Once the trace is complete, the computer will automatically reboot and will repeat this process the number of times you selected to repeat earlier. When the process is all finished, your computer will automatically load the trace file. If you performed more than one trace, you will have to manually load one of the trace files.
Analyzing the Bootvis trace file
To view a report, you will have to launch Bootvis again if you performed more than one trace. If you decided to just do one trace, skip this paragraph. When Bootvis finishes loading, click the File menu object and select Open. Navigate to C:\ Documents and Settings and then expand the folder named after your username. There you will find all of the trace files with a
.BIN extension. Select the file that you would like to analyze and select Open. Bootvis will load the trace file and display the results of the trace, as shown in Figure 7-7.
Now that you have all of the data, it is time to analyze it. The most important information that the Bootvis application provides is Driver Delay information. The drivers are the most time-consuming portion of the system boot. Identifying slow device drivers can help you speed up your system. Scroll down so that the Driver Delay window is displayed. Each device driver that is loaded during setup is sorted into different categories and is represented by a
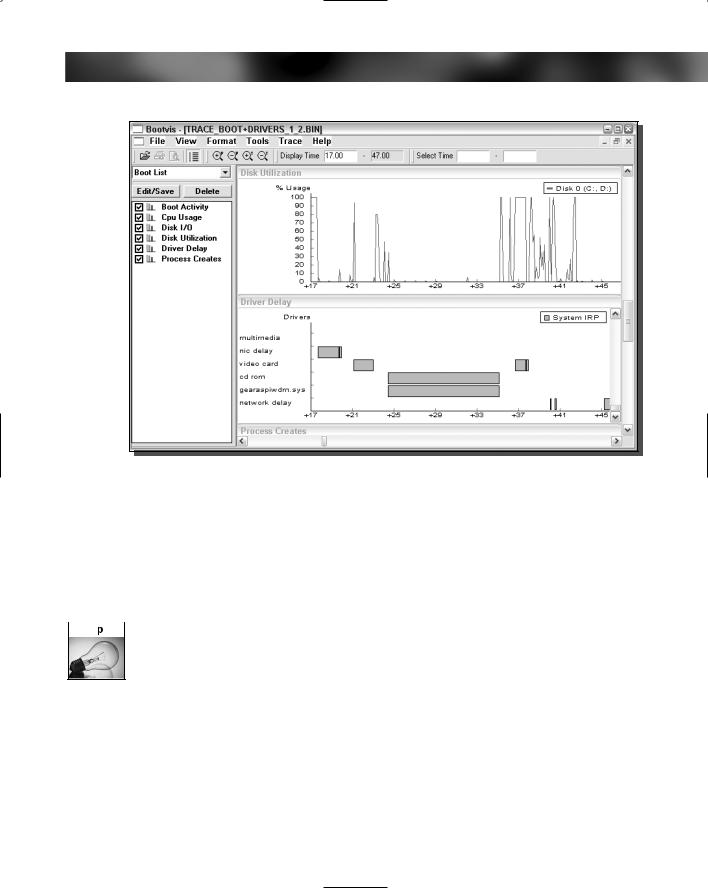
Chapter 7 — Analyzing Your System 169
FIGURE 7-7: Bootvis displaying trace results after boot analysis.
green rectangle. Move your mouse over a rectangle and the name of the driver, as well as the estimated time it took to load, will be displayed. Scroll horizontally to see the different drivers that are loaded over time.
If you find a driver that is taking a long time to load and initialize, it could be configured incorrectly or the driver itself could be poorly written and may have problems. Make sure that you have the latest device drivers from your equipment manufacturer to ensure that you have the best version of the driver code.
 You can make sure that you have the latest drivers installed on your computer by visiting your hardware manufacturer’s Web site and downloading the latest drivers. This will ensure that you have the best performing drivers and trouble-free operation.
Bootvis displays many other graphs besides the driver information. The other graphs are less useful when viewed separately, but can be valuable when viewed in conjunction with other graphs. Looking at the CPU utilization and disk utilization at the same time one of the drivers is initializing can give you valuable information, such as why the device driver could be taking so long to initialize. For example, if the CPU is maxed out and the disk utilization is very high, it might not be the driver’s fault for taking so long to initialize. Instead, it is all of the other background processes running at the same time that is slowing everything down.

170 Part II — Increasing Your System’s Performance
Bootvis also offers a feature that allows you to trace what is going on when your system is resuming from standby or starting up from hibernation. To run these types of traces, simply click the Trace menu bar item again and select either Next Standby and Resume or Next Hibernate and Resume. Then, after the traces are complete, just open up the trace files as you did previously for a normal boot trace.
Using Task Manager
The Windows Task Manager is a critical part of Windows that makes it possible for users to have full control over what their system is doing. Providing the ability to monitor individual programs and control any program or process, the Task Manager is very useful. In order to use Task Manager, no special software must be installed. Just push Ctrl Alt Delete keys on your computer and the Windows Task Manager will be loaded. On some computers, you may have to click the Task Manager button in the window that pops up in order to start it.
Once Windows Task Manager has started, you will notice a list of active applications running on your computer. Additionally, you will see five tabs that will list processes, CPU performance data, networking performance data, and active user data.
Monitoring processes
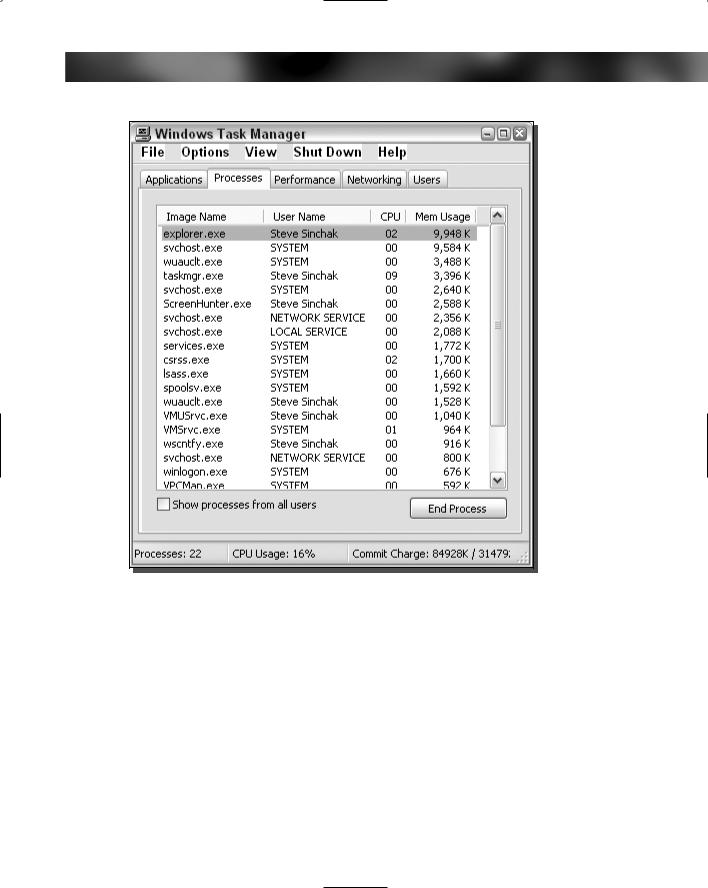
All the applications on the computer that are running, those that are hidden and those that are not, can be found on the list under the Processes tab. On this list, you will be able to see how much memory each process is using, as well as how much of the CPU each process is using. By clicking the column headings, you can sort the rows in numeric or alphabetical order, as shown in Figure 7-8.
There are many useful columns on the Processes tab, such as the Image Name column, which gives you the name of the process. The User Name column shows who started the process. The CPU column shows what percentage of the CPU the process is using and the Mem Usage column shows how much memory a process is using.
If you find a process that is taking up a lot of your memory or eating up a big portion of your CPU, then you may want to consider ending the process if it is not a critical one. Ending a process is very easy; just select the row of the service you want to end, and click the End Process button.
Viewing performance data
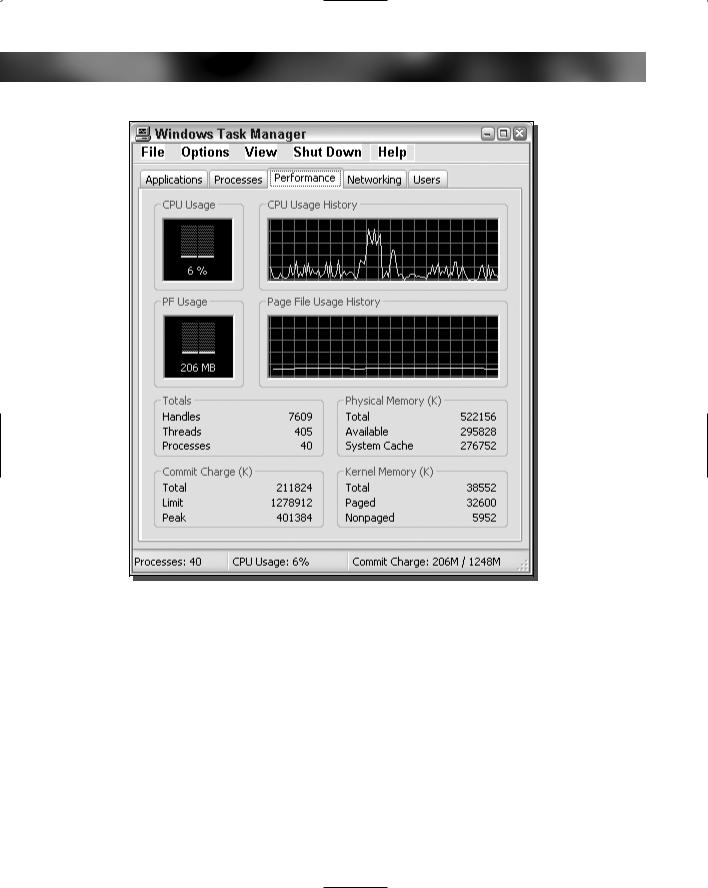
When you visit the Performance tab, as shown in Figure 7-9, you will notice that it shows a lot of the same information that the Performance application shows. This tab is another place that you can view memory and CPU information but in a far less detailed manner.
The Networking tab is a great way to monitor the current network activity. Each networking device on your computer has its own graph, showing the percent that it utilized. Although it does not keep track of bandwidth sent and received, it does show the speed at which the hardware is working and if it is connected.
Configuring Task Manager to display CPU monitor
When the Windows Task Manager is started, a small histogram is displayed in the system tray that shows the CPU utilization. This little feature can be very useful if you would always like to
Chapter 7 — Analyzing Your System 171
FIGURE 7-8: Sorting processes by memory usage.
keep an eye on your CPU utilization but do not want Task Manager always on top of all of your windows. With a little bit of work, it is possible to start up the Windows Task Manager automatically and run it minimized and hidden from the taskbar except for the system tray.
1.Click the Start Menu and navigate to All Programs and locate the Startup listing.
2.Right-click where it says Startup and select Open. A new window will open up with the contents of your personal startup folder. Any shortcuts that you place in this folder will be automatically loaded with Windows when it starts up.
3.Once the Startup folder is opened, right-click in the open white space and select New and then navigate to Shortcut.
4.When the new shortcut wizard loads, type taskmgr.exe in the text box asking for the location of the file. After typing in the file name, click the Next button.
172 Part II — Increasing Your System’s Performance
FIGURE 7-9: Windows Task Manager Performance information.
5.Type in a name for the shortcut and click the Finish button.
6.Now you will be shown the startup folder again and a new icon for the Task Manager. In order to make Task Manager start minimized, right-click the new icon and select Properties.
7.Change the Run type where it says Normal Window to Minimized and click OK.
8.Now the shortcut is all set up. However, there is one last change to make and you will need to open up Task Manager to do this. Once you have opened up Windows Task Manager, click the Options menu bar item and select Hide When Minimized so that when the program starts, the CPU histogram will only be shown and the program will not appear on the taskbar.