


Chapter 7 — Analyzing Your System 173
Your system is not configured to start up the CPU meter on every boot in the system tray. Should you change your mind at a later time and no longer want the Task Manager CPU meter to show up, simply delete the shortcut from the Startup folder.
Other performance monitoring utilities
On top of all of the Microsoft applications, there are various third-party applications that provide system information. One of my favorite monitoring utilities is an open source program called CoolMon. CoolMon is a highly customizable program that allows you to display a wide range of information about your computer, such as:
System Temperature (Requires additional Mother Board Monitor application)
Fan Speeds (Requires additional Mother Board Monitor application)
Network Information
Memory Information
System Uptime
CPU Information
Physical Disk Information
Power and Battery Information
CoolMon can be downloaded from http://coolmon.arsware.org.
Once you have installed CoolMon, you are ready to start configuring it. Everything about the appearance can be changed by navigating through the Layout menu that can be accessed by right-clicking the CoolMon icon in the system tray.
If you would like to change the information that is displayed, simply right-click the CoolMon icon in the system tray and select Display Items. You will then see a new window called Options that looks like a text editor. The CoolMon program uses its own markup language to establish how the information will be laid out. Browse through the drop-down box located in the middle of the window to select different items that can be displayed. Once you have selected the item that you want to add, click the Add Tag button and the text above will be updated. When you are finished with the layout, click the OK button to see the new information.
Benchmarking Your System
Benchmarking means testing your computer and assigning some sort of score to your computer’s configuration. The score could be an amount of time, such as the amount of time it takes your computer to solve a complex math problem. The score could also be a calculated point value that is determined by running a variety of tests, such as hard drive transfer speeds. The test could read and write files to your hard drive and then calculate a weighted score depending on how each test went. The amount of time or calculated point value have very little value on their own; it is when they are compared to other results of the same test that they become valuable.

174 Part II — Increasing Your System’s Performance
It is important to get an initial benchmark score for your computer so that you can compare your computer’s initial performance to benchmark scores from tests that you may run at a later time. It would be nice to know how much of a difference some of the hacks in this book actually helped your system. Or, if you upgraded the amount of RAM your computer has, it would be helpful to see how it impacted your system performance. By running an initial benchmark, you will have a score that you can compare all of your benchmark scores to after you make changes to your computer.
How to benchmark your system
In order to benchmark your system, you will need the help of a benchmarking application. There is a wide variety of different software programs that can benchmark just about every part of your system. If you are interested in benchmarking the abilities of your 3D video card, there is software for that. If you are interested in benchmarking your hard disk speeds, then there is special software for that task as well. On top of the individual tests, there are a lot of benchmarking suites on the market. One is known as Sandra Standard and is published by SiSoftware. The next section will show you how to use Sandra Standard to benchmark your computer.
 You will find several links to different benchmarking applications that you can use to benchmark specific hardware components of your computer in the Chapter 7 folder of the companion CD-ROM.
Using Sandra Standard to benchmark
Sandra Standard is a great program to use to benchmark your computer because it has a wide variety of individual tests, and it’s free. To get started, you will need to download a copy of Sandra Standard from the Web site located at www.sisoftware.co.uk. Once you have Sandra Standard installed, you will be able to begin testing and benchmarking your system. To start Sandra Standard, click the Start Menu and expand All Programs and SiSoftware Utilities (Win32 x86), then click SiSoftware Sandra Standard (Win32 x86 Unicode) to launch Sandra. Once Sandra is started, and you have closed the Tip of the Day, you will see a list of different information and testing modules, as shown in Figure 7-10.
In order to run a benchmark, just double-click the icon of the benchmark you would like to run. For an example, let’s run the CPU Arithmetic Benchmark. Scroll down on the list and list of icons until you find the CPU Arithmetic Benchmark icon and then double-click it. Once it loads, click the blue Refresh arrow button or press F5 on your keyboard to start the benchmark. Once the benchmark starts, the Analyzing window will be shown that indicates the progress of the test. Do not touch your keyboard or mouse while the test is running. On some benchmarks, the status bar does not update very frequently, so don’t get worried if the benchmark seems to be frozen; most likely it is not. The vast majority of the benchmarks take only a few minutes to run, although a few may take up to 10 minutes. When the test is over, the results will be displayed in comparison to other hardware configurations.
CPU Arithmetic Benchmark
The CPU Arithmetic Benchmark will run a series of standard CPU benchmarks, such as the Dhrystone (integer arithmetic such as whole number addition) and Whetstore (floating point

Chapter 7 — Analyzing Your System 175
FIGURE 7-10: Sandra Standard benchmark modules.
arithmetic such as decimal addition) benchmark tests. This test takes about 30 seconds to run but is repeated several times to get an accurate test result. All together, this test takes between two to five minutes to run. This test is not very useful for measuring how much faster you have made your computer but it is useful to compare how fast your CPU is compared to other systems. Within the module, the results of the test will be compared against other similar systems and you can select any processor to compare it against.
CPU Multimedia Benchmark
The CPU in your computer is a lot more advanced than CPUs from 20 years ago, which just did basic computer functions. With the growing need for high-performance multimedia applications such as 3D games and DVD players, CPU manufacturers started to include advanced instructions in the design of the chip that would allow for special multimedia performance increases. The CPU multimedia benchmark is designed to test the most popular multimedia extensions that your computer is equipped with, such as MMX, 3DNow, SSE2, and SSE3. The test will take about 20 seconds but it will repeat a few times to get reliable results. During the test, a fractal is generated and other objects using the multimedia extensions. The results are then calculated and repeated for both integer (whole numbers) and floating point (decimal) calculations and displayed in comparison to other systems.

176 Part II — Increasing Your System’s Performance
Removable Storage/Flash Benchmark
The Storage/Flash Benchmark will measure the speed of the flash-based storage devices, such as USB pen drives and compact flash-based cards, used in many digital cameras. The benchmark module tests the read performance, write performance, as well as the delete performance. Then, based on the performance in each area, the drive is given a drive index score. After the test, the actual data speeds are available and the device can also be compared to similar devices. This test can take up to 10 minutes to complete and cannot be canceled while it’s performing.
File System Benchmark
The File System Benchmark is similar to the flash storage benchmark but is designed for different hardware, such as hard drives. The File System Benchmark tests the drive by doing a series of read tests that test reading data from random locations, reading data from a series of adjacent locations, and reading data from the disk buffer. Additionally, the file system benchmark tests the writing speed by writing data to random locations, writing data to a series of adjacent locations, and writing directly to the disk buffer. To finish the benchmark, the application completes a seek test and then calculates a drive index score based on the results of the three types of tests. The data is then displayed in comparison with similar types of drives.
CD-ROM/DVD Benchmark
The CD-ROM/DVD Benchmark test is similar to the file system benchmark but is designed for the optical drives. In order to run the test on a data CD drive, you must place a CD that has at least 600MB of data on it and contains large files that are greater than 64MB each. For a video CD or DVD, any VCD movie or DVD movie will do for the test. After the test is completed, which usually takes about 10 minutes, the results will be displayed in comparison with other drives.
Memory Bandwidth Benchmark
The Memory Bandwidth Benchmark tests the system memory using the popular STREAM memory benchmark. This benchmark tests the storing and retrieving of data of both integer and floating point operations. Once the test is completed, usually after two minutes, the results will be displayed. The “ALU” results are from the integer arithmetic tests and the “FPU” results are from the floating point tests. If you would like to learn more about the STREAM memory benchmark, visit www.streambench.org to find out how it works.
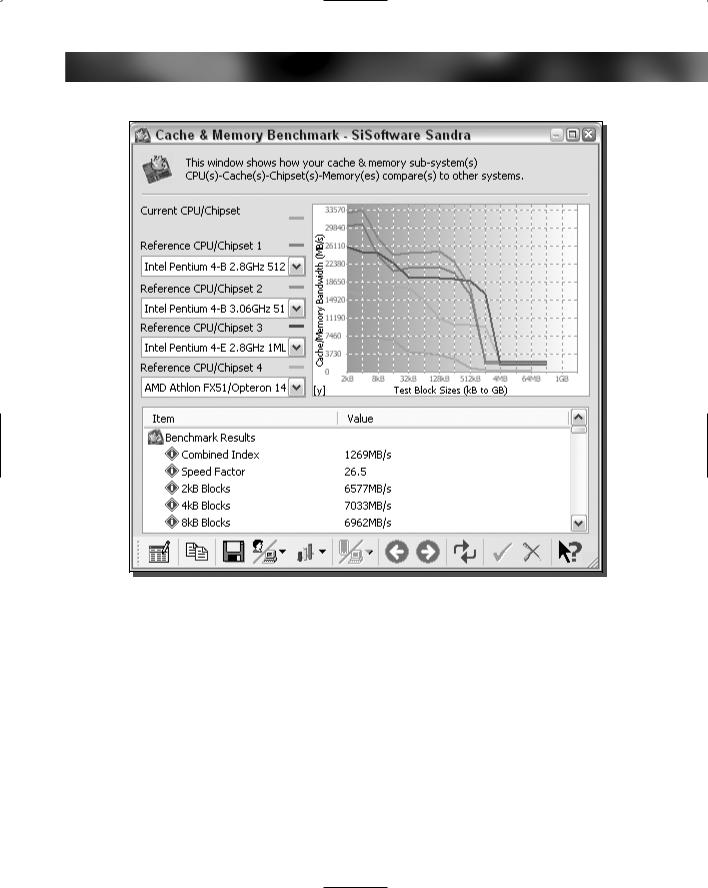
Cache & Memory Benchmark
The Cache & Memory Benchmark tests the CPU cache and memory using floating point operations. The test is designed to make it possible to compare different CPU configurations. After the test is run, which usually takes about 10 minutes, the results will be given in a graph that shows how effective the cache is at different text block sizes, as shown in Figure 7-11. This test is great for determining exactly how CPUs of the same speed but different cache sizes are different.
Network/LAN Bandwidth Benchmark
The Network/LAN Bandwidth Benchmark will measure how fast your local area network is. The test will ping and transfer data from another machine on your network to test for response time and for maximum speed. Although this test is limited to the maximum speed of the
Chapter 7 — Analyzing Your System 177
FIGURE 7-11: Results of the Cache & Memory Benchmark test.
hardware that the test is testing across the network, the benchmark is still effective when used to detect how fast your network can really go. The test may take a while to load, as it needs to search your local area network to find another machine that it can connect to so that it can run the network benchmark. Once the module loads, and the test is run, the results will be displayed within 5 minutes.
Internet Connection Benchmark
The Internet Connection Benchmark attempts to measure the speed of your Internet connection link. The test will detect the first gateway of your ISP and measure the speed of the data transferred to and from. Then the test measures the latency of your connection by pinging the gateway. The tests are run a number of times and the mean of the results is what is reported. This benchmark is useful for comparing your results against other types of connections on which the test was run. However, the numbers generated by the benchmark are not the true
178 Part II — Increasing Your System’s Performance
Internet connection speed. In order to test your Internet connection for its maximum speed, run a search on Google looking for “Speed tests” and you will find numerous sites that will help you test the maximum speed.
Internet Peerage Benchmark
The Internet Peerage Benchmark basically measures the quality of your Internet Service Provider. Peering is what a connection between other networks is called. When one ISP connects its network to another ISP, the connection is known as peering. The Internet is made up of the peering of different networks. The overall speed of your Internet connection can depend on the quality of peers your ISP has linked up with as well as the number of peers. When you browse the Web, a request is sent to the Web server of the Web site. The Web servers are located all over the world in different places. Therefore, the speed of connecting to one Web site could be different than the speed of connecting to another Web site. The speed of the peers determines the speed of your Internet connection. The peerage benchmark attempts to measure the speed of a variety of popular Web sites and then calculate an average speed. The test only takes a few minutes. Once the test is completed, the results will be displayed in comparison to other ISPs and connection types.
Using Bootvis to benchmark
Bootvis is a great diagnostic tool that is good for zeroing in on problematic drivers and services that are resident in the system startup. Finding a new device driver or a different application version is one solution when you have a driver that is taking a long time to start up. Before you update the device driver or application service, you really should set a benchmark to see if the new driver or application has made a difference or if the new driver or application has decreased performance further.
New problems often arise in new drivers and versions of applications. Upgrading the latest version of the drivers and applications will help in the majority of cases. However, sometimes they may not, and may even prove to be detrimental. In those cases, you should be able
to see what the net effect of the change is. One easy solution to finding the net effect on the change would be to benchmark the driver loading time.
This can be done manually by running a trace on the boot, as was discussed earlier in this chapter, and then running some simple calculations to get an accurate benchmark number. Follow these simple steps:
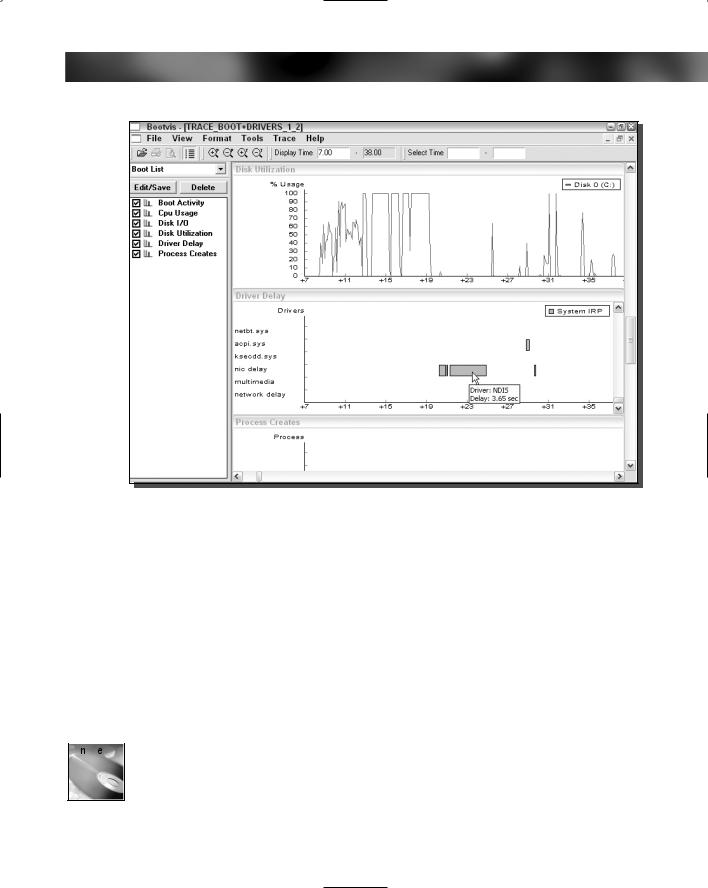
1.Start up Bootvis and set up a Next Boot Driver Delay trace. You really should set the boot trace to repeat at least three times to get an accurate benchmark.
2.Once the system has restarted and traced the boot the number of times you have specified, open up each file and determine how long a specific driver took to initialize by looking at the Driver Delay window and moving the mouse cursor over the green rectangles, as shown in Figure 7-12.
3.Keep track of all of the different delay times for each of the boot trace files. Then once you have a minimum of five different times, throw out the extremes and calculate the mean of the remaining values. Save the value that you calculate so that you will have something to compare it to later.
Chapter 7 — Analyzing Your System 179
FIGURE 7-12: Determining how long a driver took to initialize by positioning the mouse over the driver rectangle.
4.Once you have updated the device driver, repeat the previous process to calculate a new benchmark value that you can compare to the original value that was calculated.
Benchmarking with PCMark04
PCMark 2004 edition, from Futuremark Corporation, is one of the most popular benchmarking programs for power users available. PCMark 2004 has a cool online component that allows you to view your benchmark data on their Web site and compare it to other users’ computers. The PCMark04 application is a great way to provide your computer with an overall score. This score can be used to compare your system to other systems. The comprehensive score that is assigned to your system is the result of numerous test results testing various parts of your computer.
A copy of PCMark04 can be downloaded from www.futuremark.com/download/.
 A link to the Futuremark Web site, where you can download PCMark04, is found on the CD-ROM at the back of the book.

180 Part II — Increasing Your System’s Performance
The user interface of PCMark04 is very simple and easy to use. Simply click the Run PCmar button to start the tests. Included with the free version are only the basic system tests that are run to simulate normal computer usage. The basic system tests include the following:
File compression and decompression benchmark tests, which test the CPU’s ability to do integer calculations by compressing and then extracting a text file similar to using applications such as WinZip to put your files in a compressed ZIP file.
File encrypting and decrypting benchmark tests, which encrypt and decrypt both an image and audio file. This test uses the popular blowfish encryption algorithm to encrypt the files and measure how long it takes your computer to encrypt and decrypt the files.
Virus Scanning benchmark tests, which test the computer’s ability to scan files. This test simulates an anti-virus program to see how fast your hard drive is as well as the CPU’s performance as it scans document, executable, and image files.
Grammar Check benchmark tests, which test the speed of the CPU by simulating the common task of using a word processor. For example, it took your computer 24 seconds to check a document’s grammar.
Audio Conversion benchmark tests, which are used to test the CPU floating point performance by converting a wav audio file into an ogg vorbis (a new audio compression format similar to a MP3) file.
Image processing benchmark tests, which test the CPU performance by reading and decoding JPEG image files to get an elapsed time reading.
Web Page rendering benchmark tests, which test the CPU and system memory by loading several Web pages to calculate how many sample Web pages can be rendered per one second.
WMV Video Rendering benchmark tests, which are used to test how fast the computer can encode a video clip at 320 x 240 resolution at 1000 kbps rate in Windows Media 9 format.
Divix Video Rendering benchmark tests, which check how fast the computer can encode a video clip at 720 x 480 resolution in the popular Divix codec.
Physics & 3D benchmark tests, which test the gaming abilities of your PC by running a 3D test that measures frames per second while calculating many physical objects.
Graphics Memory benchmark tests, which check the memory on the video card as well as the AGP bus speed by running read/write tests directly in the memory over the AGP bus.
Once you click the Run PCmark button, the system tests will begin, as shown in Figure 7-13.
Once the benchmark tests are completed, you will be shown your system’s overall score. To view the detailed scores of the different tests, you will have to register on Futermark’s Web site via the link on your results window. This is a slight letdown, but registering on the site allows you to compare your system against other systems. You can find out what hardware really performs and what hardware you should avoid. Overall, the PCMark04 Web site adds a great amount of value to the application.