386 Part VI: The Part of Tens
Checking Use Syntax Highlighting tells the editor to color words within your program to indicate their type. The editor flags comment lines with one color, keywords such as switch another, variable names yet another, and so on. The myriad of colors is a little nauseating at first, but it’s very useful once you get used to it. You can change the colors used, but I don’t see much point in doing so.
The Auto Indent feature is intended to be a labor saving device: The editor tabs the cursor over the “appropriate” column when you press Return. Normally, the appropriate column is the same as the previous line that isn’t a comment or blank. The cursor automatically indents after an open brace. Unfortunately, it doesn’t unindent upon seeing a close brace (nothing’s perfect). Backspace Unindents is a related and corresponding setting.
I deselected Use Tab Character. This forces the editor to use spaces, and spaces only, to position the cursor. I did this primarily because I cut and pasted programs from Dev-C++ into my word processor when writing this book.
The Highlight matching braces/parenthesis setting has a serious implication that gets its own Top 10 listing.
Highlight Matching Braces/Parentheses
The Highlight matching braces/parenthesis setting appears in the Editor Options window that is accessible from the Tools menu. When set, the Dev- C++ editor looks for the corresponding opening brace whenever you enter a closed brace. In addition, when you select either an open or closed brace, Dev-C++ changes the corresponding brace to Bold. The same rules apply for parentheses.
This feature helps you keep your braces matched. You can easily forget a closed brace when you’re entering your program. It’s just as easy to get the braces screwed up when editing your program.
There is, however, a serious downside when using Dev-C++ Version 4.9.8.0: You can’t open a module in which there are more open braces than closed braces. It seems that the editor scans your .cpp file when you open it to figure out which closed brace goes with which open brace. The editor hangs up if it runs out of program before it finds enough closed braces.
Thus, if Dev-C++ appears to just go away when you open your C++ source code module, try the following:
1.Kill Dev-C++ — it’s not going to return anyway. Press Control-Alt-Delete. Select the Task Manager option. Select Dev-C++ from the list of active programs that appear. Finally, select End Task.

Chapter 30: The Ten Most Important Optional Features of Dev-C++ 387
2.Start Dev-C++ from the Start menu without a file.
3.Uncheck the Highlight matching flag.
4.Open your file.
If that doesn’t work, punt and download the most recent version from the
www.bloodshed.net Web site, because something is wrong.
Enable Exception Handling
Exception handling is the flexible error handling mechanism discussed in Chapter 25. Choose Tools Compiler Options. Select the Settings tab. Work your way through the tree of compiler options in the left window until you find Code Generation. Make sure that the Enable exception handling flag is set to Yes — the default for this setting is No.
Adding exception handling code makes your program slightly larger and slightly slower. However, that’s a small price to pay for the exception error handling mechanism. See Chapter 25 if you don’t believe me.
Include Debugging Information (Sometimes)
The Generate debugging information flag is also one of the compiler options. Choose Tools Compiler Options. Select the Settings tab. Click Linker in the options tree. The Generate debugging information flag should be set to Yes during the debug process. The debugger doesn’t work if this flag isn’t set. In addition, Dev-C++ has only limited information to fall back on if your program crashes.
When the debugging flag is set to Yes, Dev-C++ includes the location within the program of every label and every line of code. (That’s how the debugger knows where to set breakpoints.) Even lines of code from library routines, code that you didn’t write, are included. All this location information can add up. This information adds to the executable file.
I compiled one of my programs first with the debug flag turned on and a second time with it turned off. The executable was a whopping 1.2MB. The same program generated a 440K executable file.
The moral is: Be sure that the Generate debugging information flag is acti vated during the entire development period, but clear the flag for the final release version.


Chapter 30: The Ten Most Important Optional Features of Dev-C++ 389
Avoid Illegal Filenames
Dev-C++ isn’t very good at identifying illegal filenames. Rather than generat ing a meaningful message (such as maybe, “Illegal Filename”), the compiler generates a string of misleading error messages.
Dev-C++ can’t handle filenames that contain spaces. The filename My Program.cpp is not allowed. Nor can it handle folder names containing spaces. The filename C:\My Folder\MyProgram.cpp is not legal either.
Dev-C++ can handle network files, but the Console window cannot. Thus, you can compile the program \\Randy\MyFolder\MyProgram.cpp, but you can’t debug resulting executable. In addition, the program executes normally at first but generates some obscure operating system error message before it completes.
Include #include Files in Your Project
C++ allows you to collect statements into separate files that you can #include in multiple source files. C++ puts no restrictions on the type of things that you can put in an include file. However, you should put only the following types of statements in an include file:
Function prototypes
Class definitions
Template definitions of all types
Definition of all global variables
You should not include executable statements (except for functions within the class definition itself) in an include file. Remember to add the include file name to the project list, even though it contains no source code. Doing so tells Dev-C++ to rebuild the C++ source whenever an include file changes.
Executing the Profiler
You shouldn’t be overly concerned with how fast your program will run when you’re writing. (By this, I’m not suggesting that you do really stupid things that take up lots of computer time.) It’s hard enough to write a working pro gram without worrying about writing tricky “efficient” C++ code statements. In addition, it’s an odd fact that, if you ask a programmer where she spends most of her programming time, she’s almost always wrong!

390 Part VI: The Part of Tens
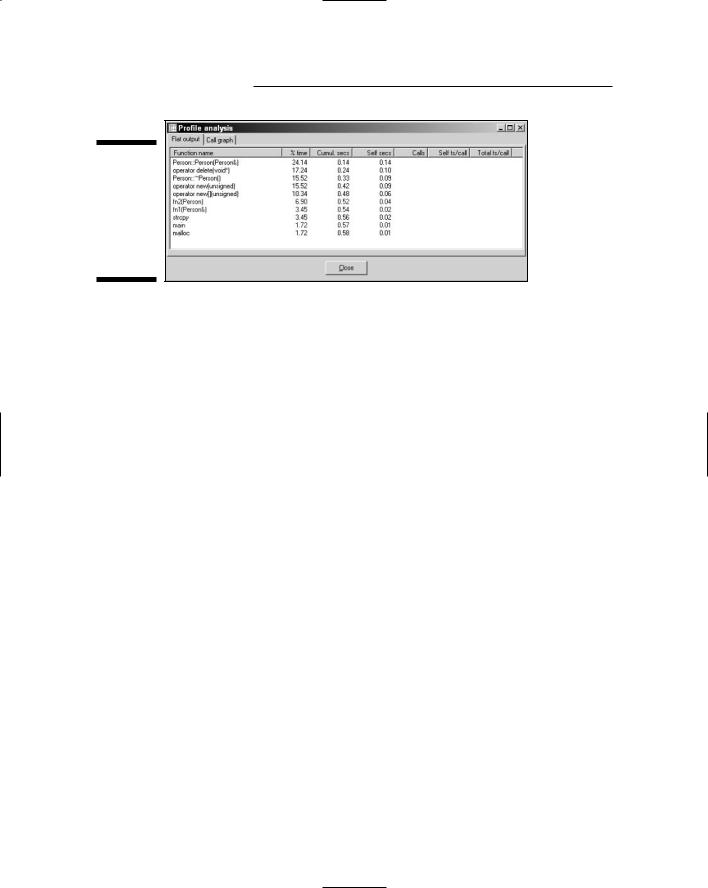
But what if your program is too slow and you want to spiff it up? Fortunately, Dev-C++ (and most other C++ environments) offers something known as a profiler. This nifty little tool watches your program to determine where it’s spending its time. Once you know that, you can decide where to spend your valuable coding time.
To enable Profiling, I chose Tools Compiler Options. Then I selected Settings and Code profiling to set Generate Profiling Info for Analysis.
I then added the following edited version of the DeepCopy program from
Chapter 18:
//
// DeepCopy - provide a program to profile
//
#include <cstdio> #include <cstdlib> #include <iostream> #include <strings.h>
#include <profile.h> using namespace std;
class Person
{
public: Person(char *pN)
{
pName = new char[strlen(pN) + 1]; if (pName != 0)
{
strcpy(pName, pN);
}
}
Person(Person& p)
{
pName = new char[strlen(p.pName) + 1]; if (pName != 0)
{
strcpy(pName, p.pName);
}
}
~Person()
{
if (pName != 0)
{
delete pName; pName = 0;
}
}