

vk.com/club152685050Modeling Radiation and|Naturalvk.com/id446425943Convection
8.4.9. Postprocessing
1.Enable the postprocessing view by clicking  in the objects toolbar and selecting Post Processing.
2.Disable lighting.


 View → Graphics
  Lights...
a.Disable Light On and click Apply.
b.Close the Lights dialog box.
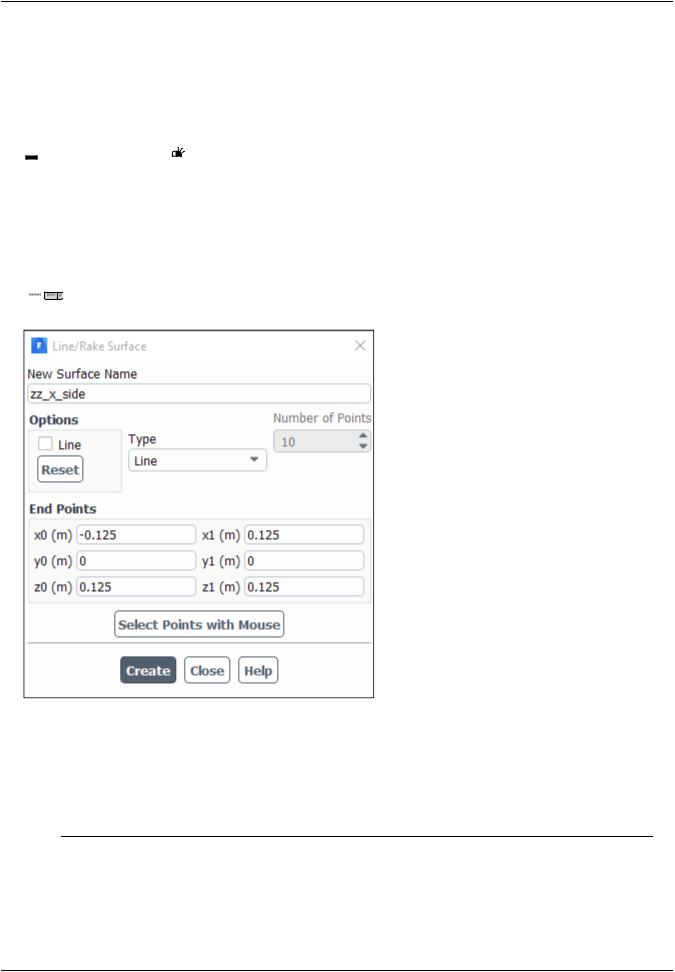
3.Create a new surface, zz_x_side, which will be used later to plot wall temperature.
 Results → Surface → Create → Line/Rake...
a. Enter zz_x_side for New Surface Name.
Note
If you want to delete or otherwise manipulate any surfaces, click Manage... to open the Surfaces dialog box.
b.Enter (-0.125, 0, 0.125) for (x0, y0, z0), respectively.
c.Enter (0.125, 0, 0.125) for (x1, y1, z1), respectively.
d.Click Create and close the Line/Rake Surface dialog box.
|
Release 2019 R1 - © ANSYS,Inc.All rights reserved.- Contains proprietary and confidential information |
298 |
of ANSYS, Inc. and its subsidiaries and affiliates. |

vk.com/club152685050 | vk.com/id446425943 |
Setup and Solution |
4.Display contours of static temperature.

 Results → Graphics → Contours → Edit...
a.Enable the Filled option in the Options group box.
b.Select Temperature... and Static Temperature from the Contours of drop-down lists.
c.Select zz_center_z from the Surfaces selection list.
d.Enable the Draw Mesh option in the Options group box to open the Mesh Display dialog box.
i.Ensure Outline is selected in the Edge Type group box.
ii.Close the Mesh Display dialog box.
e.Disable the Auto Range option.
f.Enter 421 K for Min and 473.15 K for Max.
g.Click Display, rotate the view as shown in Figure 8.5: Contours of Static Temperature (p. 300), and close the Contours dialog box.
Release 2019 R1 - © ANSYS,Inc.All rights reserved.- Contains proprietary and confidential information |
|
of ANSYS, Inc. and its subsidiaries and affiliates. |
299 |

vk.com/club152685050Modeling Radiation and|Naturalvk.com/id446425943Convection
Figure 8.5: Contours of Static Temperature
A regular check for most buoyant cases is to look for evidence of stratification in the temperature field. This is observed as nearly horizontal bands of similar temperature. These may be broken or disturbed by buoyant plumes. For this case you can expect reasonable stratification with some disturbance at the vertical walls where the air is driven around. Inspection of the temperature contours in Figure 8.5: Contours of Static Temperature (p. 300) reveals that the solution appears as expected.
5.Create and display a contour definition for wall temperature (surfaces in contact with the fluid).
 Results → Graphics → Contours → New...
|
Release 2019 R1 - © ANSYS,Inc.All rights reserved.- Contains proprietary and confidential information |
300 |
of ANSYS, Inc. and its subsidiaries and affiliates. |

vk.com/club152685050 | vk.com/id446425943 |
Setup and Solution |
a.Enter wall-temperature for Contour Name.
b.Ensure that the Filled option is enabled in the Options group box.
c.Disable the Node Values option.
d.Select Temperature... and Wall Temperature from the Contours of drop-down lists.
e.Select all surfaces except default-interior and zz_x_side in the Surfaces selection list.
f.Enter 413 K for Min and 473.15 K for Max.
g.Click Save/Display, and rotate the view as shown in Figure 8.6: Contours of Wall Temperature (p. 302).
Release 2019 R1 - © ANSYS,Inc.All rights reserved.- Contains proprietary and confidential information |
|
of ANSYS, Inc. and its subsidiaries and affiliates. |
301 |

vk.com/club152685050Modeling Radiation and|Naturalvk.com/id446425943Convection
Figure 8.6: Contours of Wall Temperature
6.Display contours of radiation heat flux.

 Results → Graphics → Contours → Edit...
|
Release 2019 R1 - © ANSYS,Inc.All rights reserved.- Contains proprietary and confidential information |
302 |
of ANSYS, Inc. and its subsidiaries and affiliates. |

vk.com/club152685050 | vk.com/id446425943 |
Setup and Solution |
a.Ensure that the Filled option is enabled in the Options group box.
b.Enable Auto Range.
c.Select Wall Fluxes... and Radiation Heat Flux from the Contours of drop-down list.
d.Make sure that all surfaces except default-interior and zz_x_side are selected in the Surfaces selection list.
e.Click Display.
f.Close the Contours dialog box.
Figure 8.7: Contours of Radiation Heat Flux (p. 304) shows the radiating wall (w-low-x) with positive heat flux and all other walls with negative heat flux.
Release 2019 R1 - © ANSYS,Inc.All rights reserved.- Contains proprietary and confidential information |
|
of ANSYS, Inc. and its subsidiaries and affiliates. |
303 |

vk.com/club152685050Modeling Radiation and|Naturalvk.com/id446425943Convection
Figure 8.7: Contours of Radiation Heat Flux
7.Display vectors of velocity magnitude.

 Results → Graphics → Vectors → Edit...
a. Retain the default selection of Velocity from the Vectors of drop-down list.
|
Release 2019 R1 - © ANSYS,Inc.All rights reserved.- Contains proprietary and confidential information |
304 |
of ANSYS, Inc. and its subsidiaries and affiliates. |

vk.com/club152685050 | vk.com/id446425943 |
Setup and Solution |
b.Retain the default selection of Velocity... and Velocity Magnitude from the Color by drop-down lists.
c.Select zz_center_z from the Surfaces selection list.
d.Enter 0.2 for Scale.
e.Click Display and rotate the view as shown in Figure 8.8: Vectors of Velocity Magnitude (p. 305).
f.Close the Vectors dialog box.
Figure 8.8: Vectors of Velocity Magnitude
8.Compute view factors and radiation emitted from the front wall (w-high-x) to all other walls. In the Results tab, click S2S Information... (Model Specific group box).
 Results → Model Specific → S2S Information...
a.Ensure that the View Factors option is enabled in the Report Options group box.
b.Enable the Incident Radiation option.
Release 2019 R1 - © ANSYS,Inc.All rights reserved.- Contains proprietary and confidential information |
|
of ANSYS, Inc. and its subsidiaries and affiliates. |
305 |
vk.com/club152685050Modeling Radiation and|Naturalvk.com/id446425943Convection
c.Select w-high-x from the From selection list.
d.Select all zones except w-high-x from the To selection list.
e.Click Compute and close the S2S Information dialog box.
The computed values of the view factors and incident radiation are displayed in the console. A view factor of approximately 0.2 for each wall is a good value for the square box.
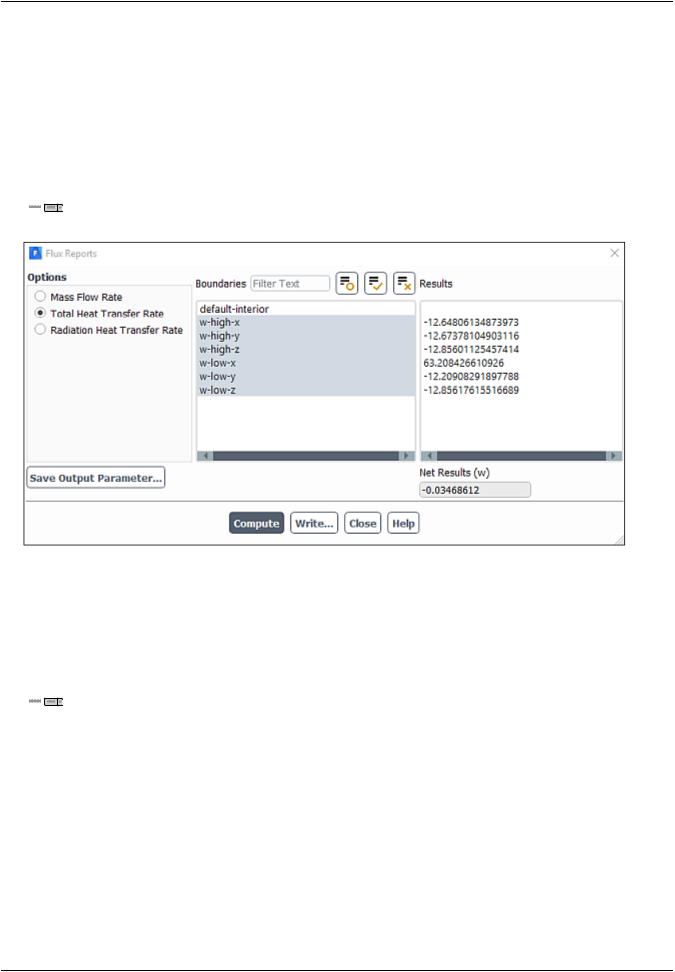
9.Compute the total heat transfer rate.
 Results → Reports → Fluxes...
a.Select Total Heat Transfer Rate from the Options list.
b.Select all boundary zones except default-interior from the Boundaries selection list.
c.Click Compute.
10.Compute the total heat transfer rate for w-low-x.
 Results → Reports → Fluxes...
|
Release 2019 R1 - © ANSYS,Inc.All rights reserved.- Contains proprietary and confidential information |
306 |
of ANSYS, Inc. and its subsidiaries and affiliates. |
vk.com/club152685050 | vk.com/id446425943 |
Setup and Solution |
a.Retain the selection of Total Heat Transfer Rate from the Options list.
b.Deselect all boundary zones and select w-low-x from the Boundaries selection list.
c.Click Compute.
11.Compute the radiation heat transfer rate.
 Results → Reports → Fluxes...
a.Select Radiation Heat Transfer Rate from the Options list.
b.Select all boundary zones except default-interior from the Boundaries selection list.
c.Click Compute.
Release 2019 R1 - © ANSYS,Inc.All rights reserved.- Contains proprietary and confidential information |
|
of ANSYS, Inc. and its subsidiaries and affiliates. |
307 |

vk.com/club152685050Modeling Radiation and|Naturalvk.com/id446425943Convection
12.Compute the radiation heat transfer rate for w-low-x.

 Results → Reports → Fluxes...
a.Retain the selection of Radiation Heat Transfer Rate from the Options list.
b.Deselect all boundary zones and select w-low-x from the Boundaries selection list.
c.Click Compute and close the Flux Reports dialog box.
The net heat load is approximately 51.5 W. After comparing the total heat transfer rate and radiation heat transfer rate, it can be concluded that radiation is the dominant mode of heat transfer.
13.Display the temperature profile for the side wall.

 Results → Plots → XY Plot → Edit...
|
Release 2019 R1 - © ANSYS,Inc.All rights reserved.- Contains proprietary and confidential information |
308 |
of ANSYS, Inc. and its subsidiaries and affiliates. |

vk.com/club152685050 | vk.com/id446425943 |
Setup and Solution |
a.Select Temperature... and Wall Temperature from the Y Axis Function drop-down lists.
b.Retain the default selection of Direction Vector from the X Axis Function drop-down list.
c.Select zz_x_side from the Surfaces selection list.
d.Click Plot (Figure 8.9: Temperature Profile Along the Outer Surface of the Box (p. 310)).
e.Enable the Write to File option and click the Write... button to open the Select File dialog box.
i.Enter tp_100.xy for XY File.
ii.Click OK in the Select File dialog box.
f.Disable the Write to File option.
g.Close the Solution XY Plot dialog box.
Release 2019 R1 - © ANSYS,Inc.All rights reserved.- Contains proprietary and confidential information |
|
of ANSYS, Inc. and its subsidiaries and affiliates. |
309 |