


20-4 |
Operating the Trace System from System Console |
UG-VIPSUITE |
|
2015.01.23 |
|||
|
|
Signal |
|
Direction |
|
Description |
|
|
|
|
|
capturen_startofpacket |
|
Input |
|
capturen port Avalon-ST startofpacket signal. |
|
|
|
|
This signal marks the start of an Avalon-ST packet. |
|
|
|
|
|
capturen_valid |
|
Input |
|
capturen port Avalon-ST valid signal. The IP core |
|
|
|
|
asserts this signal when it produces data. |
controln_address |
|
Output |
|
controln slave port Avalon-MM address bus. This |
|
|
|
|
bus specifies a byte address in the Avalon-MM |
|
|
|
|
address space. |
|
|
|
|
|
controln_burstcount |
|
Output |
|
controln slave port Avalon-MM burstcount signal. |
|
|
|
|
This signal specifies the number of transfers in each |
|
|
|
|
burst. |
controln_byteenable |
|
Output |
|
controln slave port Avalon-MM byteenable bus. |
|
|
|
|
|
controln_debugaccess |
|
Output |
|
controln slave port Avalon-MM debugaccess signal. |
|
|
|
|
|
controln_read |
|
Output |
|
controln slave port Avalon-MM read signal. The IP |
|
|
|
|
core asserts this signal to indicate read requests from |
|
|
|
|
the master to the system interconnect fabric. |
|
|
|
|
|
controln_readdata |
|
Input |
|
controln slave port Avalon-MM readdata bus. |
|
|
|
|
These input lines carry data for read transfers. |
controln_readdatavalid |
|
Input |
|
controln slave port Avalon-MM readdatavalid |
|
|
|
|
signal. The system interconnect fabric asserts this |
|
|
|
|
signal when the requested read data has arrived. |
|
|
|
|
|
controln_write |
|
Output |
|
controln slave port Avalon-MM write signal. The IP |
|
|
|
|
core asserts this signal to indicate write requests from |
|
|
|
|
the master to the system interconnect fabric. |
controln_writedata |
|
Output |
|
controln slave port Avalon-MM write signal. The IP |
|
|
|
|
core uses these input lines for write transfers. |
|
|
|
|
|
controln_waitrequest |
|
Input |
|
controln slave port Avalon-MM waitrequest signal. |
|
|
|
|
The system interconnect fabric asserts this signal to |
|
|
|
|
cause the master port to wait. |
|
|
|
|
|
Operating the Trace System from System Console
System Console provides a GUI and a TCL-scripting API that you can use to control the trace system.
Altera Corporation |
Trace System IP Core |
|
|
Send Feedback
20-6 |
Trace Within System Console |
UG-VIPSUITE |
|
2015.01.23 |
|||
|
|
•In the System Console window, on the File menu, select Load Design. Open the Quartus II Project File (.qpf) for your design.
•From the System Console TCL shell, type the following command:
[design_load</path/to/project.qpf>]
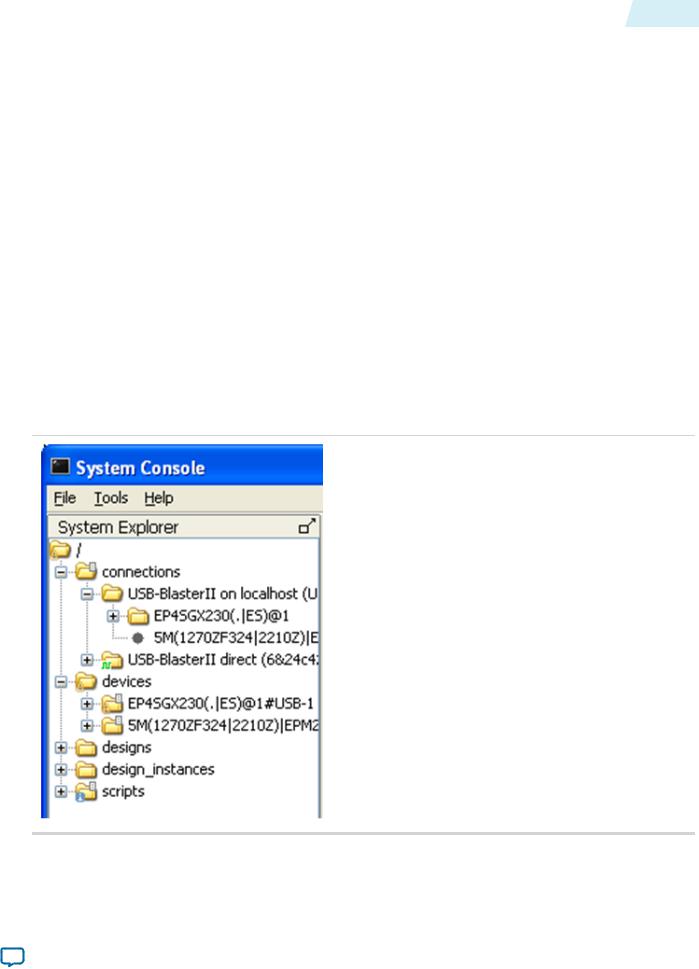
You will get a full list of loaded designs by opening the designs’ node within the System Explorer pane on the System Console window, or by typing the following command on the System Console TCL shell:
[get_service_paths design]
4.After loading your design, link it to the devices detected by System Console.
•In the System Console window, right click on the device folder, and click Link device to. Then select your uploaded design. If your design has a JTAG USERCODE, System Console is able to match it to the device and automatically links it after design is loaded.
Note: To set a JTAG USERCODE, in the Quartus II software, under Device Assignments menu, click Device and Pin Options > General Category, and turn on Auto Usercode.
•From the System Console TCL shell, type the following command to manually link the design:
[design_link <design> <device>]
Note: Both <design> and <device> are System Console paths as returned by, for example:
[lindex [get_service_paths design] 0].
When the design is loaded and linked, the nodes representing the Trace System and the monitors are visible.
Trace Within System Console
When System Console detects a trace system, the Tools menu shows Trace Table View. Select this option to display the trace table view configuration dialogue box.
Each detected trace system contains an entry at the Select hardware drop down menu. Select one of them and the available settings for its monitors will display. Each type of monitor provides a different set of settings, which can be changed by clicking on the Value column.
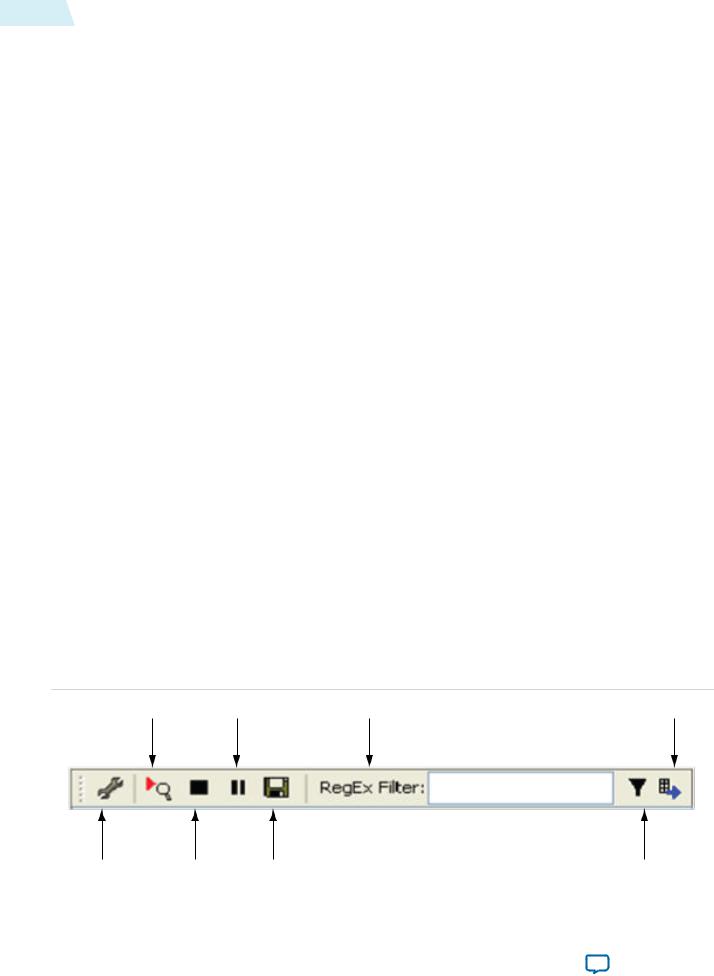
Figure 20-2: Trace Control Bar Icons
The figure shows the trace control bar, which lets you control the acquisition of data through the trace system.
START |
PAUSE |
FILTER CONTROL |
EXPORT |
|
SETTINGS |
STOP |
SAVE |
FILTER |
|
|
|
|
|
|
|
|
|
|
|
|
|
|
||
Altera Corporation |
|
|
|
Trace System IP Core |
|
|
|
|
|
|
|
Send Feedback |
|

UG-VIPSUITE |
TCL Shell Commands |
20-7 |
|
2015.01.23 |
|||
|
|
Table 20-3: Functions of Trace Control Bar Icons
The table lists the trace control bar, which lets you control the acquisition of data through the trace system.
Icon |
|
Function |
|
|
|
Settings |
|
Displays the configuration dialog box again. |
|
|
|
Start |
|
Tells the trace system to start acquiring data. Data is displayed in the |
|
|
table view as soon as possible after it is acquired. |
Stop |
|
Stops acquiring data. |
|
|
|
Pause |
|
Stops the display from updating data, but does not affect data acquisi |
|
|
tion. If you want to examine some data for a length of time, it good to |
|
|
pause so that your data is not aged out of the underlying database. |
|
|
|
Save |
|
Saves the raw captured data as a trace database file. You can reload this |
|
|
file using the Open file icon in the configuration dialogue. |
Filter Control |
|
Lets you filter the captured items to be displayed, but it does not affect |
|
|
acquisition. The filter accepts standard regular expression syntax—you |
|
|
can use filters such as blue/white to select either color. |
|
|
|
Filter |
|
Opens the filter settings dialogue, that allows you to select the parts of |
|
|
the captured data you want to display. |
|
|
|
Export |
|
Exports a text file containing the current contents of the trace table |
|
|
view. Filters affect the contents of this file. |
TCL Shell Commands
You can control the Trace System IP core components from the TCL scripting interface using trace service.
Table 20-4: Trace System Commands
Command |
|
Arguments |
|
Function |
|
|
|
|
|
get_service_paths |
|
trace |
|
Returns the System Console names for all the |
|
|
|
|
Trace System IP core components which are |
|
|
|
|
currently visible. |
|
|
|
|
|
claim_service |
|
trace |
|
Opens a connection to the specified trace |
|
|
|
|
service so it can be used. Returns a new path |
|
|
<service_path> |
|
to the opened service. |
|
|
<library_name> |
|
|
|
|
|
|
|
close_service |
|
trace |
|
Closes the service so that its resources can be |
|
|
<open_service> |
|
reused. |
|
|
|
|
|
|
|
|
|
|
trace_get_monitors |
|
<open_service> |
|
Returns a list of monitor IDs—one for each |
|
|
|
|
monitor that is available on this trace system. |
|
|
|
|
|
Trace System IP Core |
Altera Corporation |
|
|
Send Feedback

20-8 |
TCL Shell Commands |
UG-VIPSUITE |
|
2015.01.23 |
|||
|
|
Command |
|
Arguments |
|
Function |
|
|
|
|
|
trace_get_monitor_info |
|
<open_service> |
|
Returns a serialized array containing |
|
|
|
|
information about the specified monitor. You |
|
|
<monitor_id> |
|
can use the array set command to convert this |
|
|
|
|
into a TCL array. |
|
|
|
|
|
trace_read_monitor |
|
<open_service> |
|
Reads a 32-bit value from configuration space |
|
|
<monitor_id> |
|
within the specified monitor. |
|
|
|
|
|
|
|
<index> |
|
|
|
|
|
|
|
trace_write_monitor |
|
<open_service> |
|
Writes a 32-bit value from configuration |
|
|
<monitor_id> |
|
space within the specified monitor. |
|
|
|
|
|
|
|
<index> |
|
|
|
|
<value> |
|
|
|
|
|
|
|
trace_get_max_db_size |
|
<open_service> |
|
Gets the maximum (in memory) trace |
|
|
|
|
database size set for this trace system. If the |
|
|
|
|
trace database size exceeds this value, then |
|
|
|
|
the oldest values are discarded. |
trace_set_max_db_size |
|
<open_service> |
|
Returns the current maximum trace database |
|
|
|
|
size. Trace database sizes are approximate but |
|
|
<size> |
|
can be used to prevent a high data rate |
|
|
|
|
monitor from using up all available memory. |
|
|
|
|
|
trace_start |
|
<open_service> |
|
Starts capturing with the specified trace |
|
|
fifo |
|
system in real time (FIFO) mode. |
|
|
|
|
|
|
|
|
|
|
trace_stop |
|
<open_service> |
|
Stops capturing with the specified trace |
|
|
|
|
system. |
|
|
|
|
|
trace_get_status |
|
<open_service> |
|
Returns the current status (idle or running) |
|
|
|
|
of the trace system. In future, new status |
|
|
|
|
values may be added. |
trace_get_db_size |
|
<open_service> |
|
Returns the approximate size of the database |
|
|
|
|
for the specified trace system. |
|
|
|
|
|
trace_save |
|
<open_service> |
|
Saves the trace database to disk. |
|
|
<filename> |
|
|
|
|
|
|
|
Altera Corporation |
Trace System IP Core |
|
|
Send Feedback
UG-VIPSUITE |
|
|
|
TCL Shell Commands |
20-9 |
|
2015.01.23 |
|
|
|
|||
|
|
|
|
|
||
|
|
|
|
|
|
|
|
Command |
|
Arguments |
|
Function |
|
|
|
|
|
|
|
|
|
trace_load |
|
<filename> |
|
Loads a trace database from disk. This returns |
|
|
|
|
|
|
a new service path, which can be viewed as if |
|
|
|
|
|
|
it is a trace system. However, at this point, the |
|
|
|
|
|
|
start, stop and other commands will |
|
|
|
|
|
|
obviously not work on a file-based node. |
|
|
|
|
|
|
If you load a new trace database with the |
|
|
|
|
|
|
trace_load command, the trace user |
|
|
|
|
|
|
interface becomes visible if it was previously |
|
|
|
|
|
|
hidden. |
|
|
|
|
|
|
|
|
Trace System IP Core |
Altera Corporation |
|
|
Send Feedback