


This material is copyright and is licensed for the sole use by Kliwon Klimis on 28th October 2008 425 cilce, , frood, grradt, 525254
Keeping an Eye on Zimbra
As we come to the end of our look into implementing and maintaining the Zimbra
Collaboration Suite, it would be a disservice to not take a few moments to look into the tools Zimbra offers for system administrators to monitor their messaging infrastructure. Being proactive is a key characteristic of any successful systems administrator, and all the monitoring tools in the world mean absolutely nothing unless the administrator is committed to using them on a consistent basis. This chapter will look into the tools Zimbra offers to provide visibility to the systems
administrators, and also focuses on the reasons why monitoring your email server is so critical. Specifically, this chapter will cover the following:
•The need for monitoring
•Working with mail queues
•Monitoring log files
Before we take a look at the various monitoring options within Zimbra, let's first take a moment to look at the reasons why monitoring the server is so important.
The Need for Monitoring
I believe it goes without saying, that monitoring any critical server within an enterprise is a key job function of a systems administrator. However, it is probably the one job function that we let fall by the wayside. It seems, in most cases, we just get too busy to monitor our servers. The problem with this fact of life, is that we could avoid so many "fires" by utilizing our monitoring tools and preventing downtime and system failures from occurring. To me, there are three main reasons why monitoring is so critical to any Zimbra implementation. These reasons are: availability, scalability, and security. This is in no way an exhaustive list of all reasons why monitoring is so important, but it is my top three.
This material is copyright and is licensed for the sole use by Kliwon Klimis on 28th October 2008 425 cilce, , frood, grradt, 525254
Keeping an Eye on Zimbra
Availability
By availability, we are concerned with the reliability and accessibility to all users at all times. In a nutshell, the word "availability" could be synonymous with up-time.
Monitoring the server provides a means by which the systems administrator could determine the availability of all services within the collaboration suite. As a prideful systems administrator, I want to be aware of a service going down and immediately be able to bring it back up, before I am notified by my users.
There are a couple of tools Zimbra provides that particularly deal with server status.
One is the GUI tool in the Administration Console, the other is the command line tool, zmcontrol. For these examples, I will be using screenshots and information from my email server for my company, as we could see some real data, however, please feel free to follow along with the server we have been working on throughout this book.
To use the Administration Console to monitor services:
1.Direct your internet browser to https://zimbra.emailcs.com:7071 and login with the admin account.
2.In the navigation pane, double click on the Server Status application in the
Monitoring group.
3.The results pane should now display a list of all of the installed Zimbra services, and their current statuses. In my case, you could see that the logger service is currently down.
[ 194 ]

This material is copyright and is licensed for the sole use by Kliwon Klimis on 28th October 2008 425 cilce, , frood, grradt, 525254
Chapter 11
Using the Administration Console is a really quick and visual way to look at the current state of your services. Restart, shutdown, or start-up services could be done through the command line using zmcontrol. However, to save a step in needing to log into the Administration Console, we could simply login to a console session, usually via SSH, on our Zimbra server, and check and restart statuses from there.
1.SSH to the Zimbra server at zimbra.emailcs.com.
2.Login as a regular user.
3.Switch the user to root using the su – and provide the root password.
4.Switch the user once more to the Zimbra user, using su – zimbra.
5.Type the command zmcontrol status to view the installed services. The results should be the same as the GUI displayed in the Administration console.
[zimbra@zimbra ~]$ zmcontrol status Host zimbra.techmaking.com
antispam |
|
Running |
antivirus |
|
Running |
ldap |
|
Running |
logger |
|
Stopped |
zmlogswatchctl is not running |
||
mailbox |
|
Running |
mta |
|
Running |
snmp |
|
Running |
spell |
|
Running |
|
|
|
|
[ 195 ] |
|
|
|
|
This material is copyright and is licensed for the sole use by Kliwon Klimis on 28th October 2008 425 cilce, , frood, grradt, 525254
Keeping an Eye on Zimbra
6.Again, we can see that the logger service is stopped.
7.To bring up the logger service again we could use zmcontrol.
zmcontrol start logger
Monitoring is obviously so much more than just watching and restarting services. However, from a user perspective, it is probably the most important part. Their only desire is to be able to work with their email, calendars, and address books when they need to. By monitoring services on a consistent basis, even services going down could be transparent to our users and keep them happy and productive.
Scalability
One of the most common questions I receive when implementing a new email system is, "What type of server do I need for this?". Of course, this question is really asking how much RAM, processor power, disk space, and networking bandwidth do I need for a successful implementation. Or really, what is the minimum amount of these things I need to purchase to get by. Well, for a new implementation, that is a very difficult question to answer. In the beginning of this book, we looked at the recommended hardware configuration for the Zimbra server, but how do we know if that is enough? Well, we could use our monitoring tools for this.
Zimbra has two server statistic measurement tools that would help in deciding if the recommended minimum requirements are not enough. So for example, let's say you go live with the recommended requirements and need to know when it is time to increase components. These two tools are the server statistics, Message Volume and Disk, both of these are located in the Administration console.
1.Login to the Administration Console at https://zimbra.emailcs.com:7071 and login as the admin user.
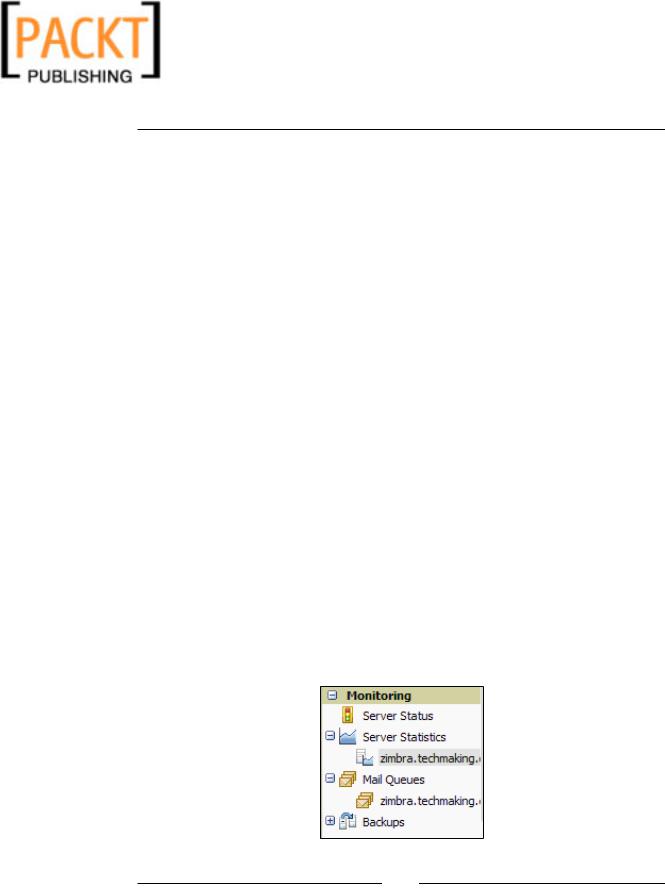
2.In the Navigation Pane, double-click on the Server Statistics application and select the server displayed in the following screenshot:
[ 196 ]

This material is copyright and is licensed for the sole use by Kliwon Klimis on 28th October 2008 425 cilce, , frood, grradt, 525254
Chapter 11
3.In the results pane, click on the Message Volume tab. This will display the aggregate size in megabytes of all messages received and sent by the server, per hour and per day.
The Message Volume information is important for two reasons. First, from a network bandwidth perspective, we could now see how much bandwidth our server is utilizing on the network sending and receiving messages. Second, we could now determine and estimate how much disk space we will require, over time, so we may determine when it is time to add more disk space and how much.
[ 197 ]