


ENGINE INDICATION SYSTEM
3.2 LEAN DISPLAY
 NOTE: The pilot should follow the engine manufacturer’s recommended leaning procedures in the Pilot’s Operating Handbook (POH).
The Lean Display is accessed by pressing the ENGINE Softkey followed by the LEAN Softkey and provides information for performing engine leaning. The engine gauge(s) and Fuel Quantity Indicator remain on the Lean Display and fuel flow is listed as a numeric readout. Exhaust gas (EGT) and cylinder head (CHT) temperatures for all cylinders are displayed graphically with numeric readouts for the selected cylinder. For turbocharged aircraft, the Turbine Inlet Temperature (TIT) Indicator is shown above the EGT Bar Graph.
Accessing the EIS Lean Display:
1)Press the ENGINE Softkey.
2)Press the LEAN Softkey.
3)To return to the default Engine Display, press the ENGINE or BACK Softkey.
From the Lean Display, the pilot can utilize the CYL SLCT and ASSIST softkeys to obtain information about specific cylinders. Pressing the CYL SLCT (Cylinder Select) Softkey cycles through the cylinders (i.e., changes the cylinder indicated on the bar graphs in light blue). This softkey is disabled when the ASSIST Softkey is pressed or when a cylinder experiences a caution or warning condition; the softkey remains disabled until the temperature returns to normal.
Monitoring the desired cylinder’s EGT and CHT:
From the Lean Display, press the CYL SLCT Softkey to cycle through each cylinder and view its EGT and CHT. The selected cylinder is shown in light blue.
The ASSIST Softkey aids in the leaning process by identifying the peak of the first cylinder whose temperature falls. This cylinder’s bar on the EGT and CHT bar graphs is highlighted in cyan as the selected cylinder. If the temperature of the peaked cylinder exceeds the peak value, the peak value is not updated. Monitoring of the cylinder continues until the ASSIST Softkey is pressed again which disables lean assist, and removes the peak block from the bar graph and the temperature deviation from peak (∆PEAK). The system then returns to seeking the hottest cylinder.
3-6 |
Garmin G1000 Pilot’s Guide for Cessna Nav III |
190-00498-03 Rev.A |

ENGINE INDICATION SYSTEM
1 Engine Manifold Pressure
Gauge (MAN IN)
Models 182T, T182T, 206H,
T206H
2 Tachometer
(RPM)
3 Fuel Flow
(FFLOW GPH)
Displays engine power in inches of mercury (in Hg)
Turbocharged aircraft – Red range indicates maximum manifold pressure Model T182T – A white tick mark indicates the cruise manifold pressure
Displays propeller speeds in revolutions per minute (rpm) Red range indicates propeller overspeed warning
Models 172S, 206H, and T206H – White high-rpm range indicates above normal operating speeds
Displays the current fuel flow in gallons per hour (gph)
4 Turbine Inlet Temperature
Indicator (TIT)
Turbocharged Aircraft
5 Exhaust Gas Temperature
Bar Graph (EGT °F)
6 Cylinder Head Temperature
Bar Graph (CHT)
7 Fuel Quantity Indicator
(FUEL QTY GAL)
Displays the temperature at the turbine inlet in degrees Fahrenheit (°F)
TIT deviation from peak (∆PEAK) is displayed below the indicator when the ASSIST Softkey is pressed.
Displays the exhaust gas temperature of all cylinders in °F; a readout for the selected cylinder (by default, the hottest cylinder) is shown below the bar graph
The selected cylinder is indicated in light blue. Cylinders whose EGTs are in the normal range appear in white.
The EGT deviation from peak (∆PEAK) for the selected cylinder is displayed below the indicator when the ASSIST Softkey is pressed.
Displays the head temperatures of all cylinders in °F; a readout for the selected cylinder (by default, the hottest cylinder) is shown below the bar graph
The selected cylinder is indicated in light blue. Cylinders whose CHTs are in the normal range appear in white. Cylinders whose CHTs enter the caution and warning ranges appear in yellow and red, respectively.
Displays the quantity of fuel in gallons (gal) in each tank (left–L and right– R)
When full, the indicator displays to 35 gal per side (26 gal for Models 172R and 172S).
190-00498-03 Rev.A |
Garmin G1000 Pilot’s Guide for Cessna Nav III |
3-7 |
ENGINE INDICATION SYSTEM
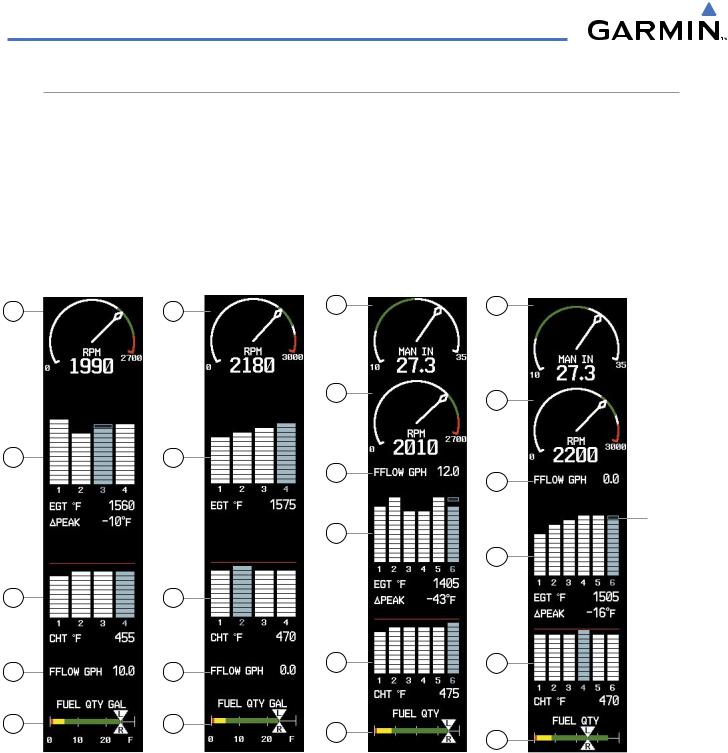
NORMALLY-ASPIRATED AIRCRAFT
2
5
6
3
7
For normally-aspirated aircraft, when a cylinder peaks, its peak is represented by a hollow block on the EGT Bar Graph. The EGT readout for the peaked cylinder, indicated on the bar graph in light blue, appears directly beneath the bar graph. The system automatically switches to the first peak obtained and displays the temperature deviation from peak (∆PEAK) in degrees Fahrenheit (°F) below the EGT readout.
Selecting the Engine Leaning Assist function:
From the Lean Display, press the ASSIST Softkey to identify the peak. The peak temperature for the selected cylinder is indicated with a hollow block on the EGT Bar Graph and the temperature deviation from peak is shown underneath the EGT Bar Graph.
2 |
1 |
1 |
|
|
|
|
2 |
2 |
|
|
|
|
|
5 |
3 |
|
|
|
3 |
|
|
|
|
|
|
|
|
Hollow |
|
|
|
Block |
|
|
5 |
Represents |
|
|
Peak |
|
|
|
|
|
|
|
|
5 |
|
6 |
|
|
|
3 |
6 |
6 |
|
|
|
|
|
7 |
7 |
|
|
|
7 |
|
|
|
|
|
Model 172R |
Model 172S |
Model 182T |
Model 206H |
|
Figure 3-6 Lean Display (Normally-aspirated Aircraft) |
|
|
3-8 |
Garmin G1000 Pilot’s Guide for Cessna Nav III |
190-00498-03 Rev.A |
ENGINE INDICATION SYSTEM
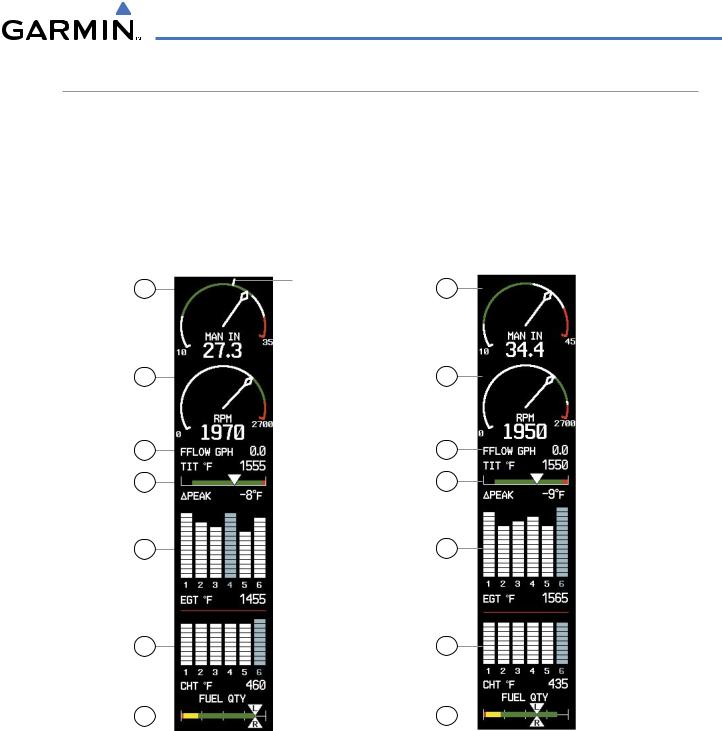
TURBOCHARGED AIRCRAFT
Leaning for turbocharged aircraft is done with reference to the Turbine Inlet Temperature (TIT). When the temperature peaks, the numeric readout (∆PEAK) appears below the TIT Indicator and displays the differencebetweenpeakandcurrentTITs,indegreesFahrenheit(°F). Ifapeakisnotdisplayed,underscores are shown until one is established.
Selecting the Engine Leaning Assist function:
From the Lean Display, press the ASSIST Softkey to identify the peak. The TIT deviation from peak is shown below the TIT Indicator.
1 |
Cruise |
1 |
|
Manifold |
|||
|
|
Pressure
2 |
2 |
3 |
3 |
4 |
4 |
5 |
5 |
6 |
6 |
7 |
|
Model T182T |
7 |
|
Model T206H |
|
|
||||
|
|
|
|
||
|
|
Figure 3-7 |
Lean Display (Turbocharged Aircraft) |
||
190-00498-03 Rev.A |
Garmin G1000 Pilot’s Guide for Cessna Nav III |
3-9 |