

- •Section 1 System Overview
- •1.1 System Description
- •1.2 Line Replaceable Units (LRU)
- •1.3 G1000 Controls
- •PFD/MFD Controls
- •Audio Panel Controls
- •1.4 Secure Digital (SD) Cards
- •1.5 System Power-up
- •1.6 System Operation
- •Normal Display Operation
- •Reversionary Display Operation
- •AHRS Operation
- •G1000 System Annunciations
- •Softkey Function
- •GPS Receiver Operation
- •1.7 Accessing G1000 Functionality
- •Menus
- •MFD Page Groups
- •MFD System Pages
- •1.8 Display Backlighting
- •Automatic Adjustment
- •Manual Adjustment
- •Section 2 Flight Instruments
- •2.1 Flight Instruments
- •Airspeed Indicator
- •Attitude Indicator
- •Altimeter
- •Vertical Speed Indicator (VSI)
- •Vertical Deviation
- •Horizontal Situation Indicator (HSI)
- •Course Deviation Indicator (CDI)
- •2.2 Supplemental Flight Data
- •Outside Air Temperature
- •Wind Data
- •Vertical Navigation (VNV) Indications
- •2.3 PFD Annunciations and Alerting Functions
- •G1000 System Alerting
- •Marker Beacon Annunciations
- •Traffic Annunciation
- •TAWS Annunciations
- •Altitude Alerting
- •Low Altitude Annunciation
- •Minimum Descent Altitude/Decision Height Alerting
- •2.4 Abnormal Operations
- •Abnormal GPS Conditions
- •Unusual Attitudes
- •Section 3 Engine Indication System (EIS)
- •3.1 Engine Display
- •3.2 Lean Display
- •Normally-aspirated Aircraft
- •Turbocharged Aircraft
- •3.3 System Display
- •Section 4 audio panel and CNS
- •4.1 Overview
- •MFD/PFD Controls and Frequency Display
- •Audio Panel Controls
- •4.2 COM Operation
- •COM Transceiver Selection and Activation
- •COM Transceiver Manual Tuning
- •Quick-Tuning and Activating 121.500 MHz
- •Auto-tuning the COM Frequency
- •Frequency Spacing
- •Automatic Squelch
- •Volume
- •4.3 NAV Operation
- •NAV Radio Selection and Activation
- •NAV Receiver Manual Tuning
- •Auto-tuning a NAV Frequency from the MFD
- •Marker Beacon Receiver
- •DME Tuning (Optional)
- •4.4 GTX 33 Mode S Transponder
- •Transponder Controls
- •Transponder Mode Selection
- •Entering a Transponder Code
- •IDENT Function
- •Flight ID Reporting
- •4.5 Additional Audio Panel Functions
- •Power-Up
- •Mono/Stereo Headsets
- •Speaker
- •Intercom
- •Passenger Address (PA) System
- •Clearance Recorder and Player
- •Entertainment Inputs
- •4.6 Audio Panel Preflight Procedure
- •4.7 Abnormal Operation
- •Stuck Microphone
- •COM Tuning Failure
- •Audio Panel Fail-Safe Operation
- •Reversionary Mode
- •Section 5 Flight Management
- •5.1 Introduction
- •Navigation Status Box
- •5.2 Using Map Displays
- •Map Orientation
- •Map Range
- •Map Panning
- •Measuring Bearing and Distance
- •Topography
- •Map Symbols
- •Airways
- •Track Vector
- •Wind Vector
- •Nav Range Ring
- •Fuel Range Ring
- •5.3 Waypoints
- •Airports
- •Intersections
- •NDBs
- •VORs
- •User Waypoints
- •5.4 Airspaces
- •5.5 Direct-to-Navigation
- •5.6 Flight Planning
- •Flight Plan Creation
- •Adding Waypoints To An Existing Flight Plan
- •Adding Airways to a Flight Plan
- •Adding Procedures To A Stored Flight Plan
- •Flight Plan Storage
- •Flight Plan Editing
- •Along Track Offsets
- •Parallel Track
- •Activating a Flight Plan Leg
- •Inverting a Flight Plan
- •Flight Plan Views
- •Closest Point of FPL
- •5.7 Vertical Navigation
- •Altitude Constraints
- •5.8 Procedures
- •Departures
- •Arrivals
- •Approaches
- •5.9 Trip Planning
- •Trip Planning
- •5.10 RAIM Prediction
- •5.11 Navigating a Flight Plan
- •5.12 Abnormal Operation
- •Section 6 Hazard Avoidance
- •6.1 XM Satellite Weather
- •Activating Services
- •Using XM Satellite Weather Products
- •6.2 WX-500 Stormscope (Optional)
- •Setting Up Stormscope on the Navigation Map
- •Selecting the Stormscope Page
- •6.3 Terrain Proximity
- •Displaying Terrain Proximity Data
- •Terrain Proximity Page
- •6.4 TAWs (Optional)
- •Displaying TAWS Data
- •TAWS Page
- •TAWS Alerts
- •System Status
- •6.5 Traffic Information Service (TIS)
- •Displaying TRAFFIC Data
- •Traffic Map Page
- •TIS Alerts
- •System Status
- •6.6 Traffic Advisory System (TAS) (Optional)
- •TAS Symbology
- •Operation
- •Altitude Display
- •Traffic Map Page Display Range
- •TAS Alerts
- •System Status
- •6.7 ADS-B Traffic (Optional)
- •Section 7 Automatic Flight Control System
- •7.2 Flight Director Operation
- •Activating the Flight Director
- •AFCS Status Box
- •Command Bars
- •Flight Director Modes
- •7.3 Vertical Modes
- •Pitch Hold Mode (PIT)
- •Selected Altitude capture Mode (ALTs)
- •Altitude hold mode (alt)
- •Vertical Speed Mode (VS)
- •Flight Level Change Mode (FLC)
- •Vertical Navigation Modes (VPTH, ALTV)
- •Glidepath Mode (GP) (waas only)
- •Glideslope Mode (GS)
- •Go Around (GA) Mode
- •7.4 Lateral Modes
- •Roll Hold Mode (ROL)
- •Heading Select Mode (HDG)
- •Navigation mode (GPS, VOR, LOC)
- •Approach mode (GPS, VAPP, LOC)
- •Backcourse Mode (BC)
- •7.5 Autopilot Operation
- •Engaging the Autopilot
- •Control Wheel Steering
- •Disengaging the Autopilot
- •7.6 Example Procedures
- •Departure
- •Intercepting a VOR Radial
- •Flying a Flight Plan/GPS Course
- •Descent
- •Approach
- •Go Around/Missed Approach
- •7.7 AFCS Annunciations and Alerts
- •AFCS Status Alerts
- •Overspeed Protection
- •Section 8 Additional Features
- •8.1 SafeTaxi
- •SafeTaxi Cycle Number and Revision
- •8.2 ChartView
- •ChartView Softkeys
- •Terminal Procedures Charts
- •Chart Options
- •Day/Night View
- •ChartView Cycle Number and Expiration Date
- •8.3 FliteCharts
- •FliteCharts Softkeys
- •Terminal Procedures Charts
- •Chart Options
- •Day/Night View
- •FliteCharts Cycle Number and Expiration Date
- •8.4 XM Radio Entertainment (Optional)
- •Activating XM Satellite Radio Services
- •Using XM Radio
- •Automatic Audio Muting
- •8.5 Scheduler
- •8.5 Abnormal Operation
- •Annunciations and Alerts
- •Alert Level Definitions
- •Nav III Aircraft Alerts
- •CO Guardian Messages
- •G1000 System Annunciations
- •Other G1000 Aural Alerts
- •G1000 System Message Advisories
- •AFCS Alerts
- •TAWS ALERTS
- •TAWS System Status Annunciations
- •SD Card Use
- •Jeppesen Databases
- •Garmin Databases
- •Glossary
- •Frequently Asked Questions
- •General TIS Information
- •Introduction
- •TIS vs. TAS/TCAS
- •TIS Limitations
- •Map Symbols
- •Index
HAZARD AVOIDANCE
SECTION 6 HAZARD AVOIDANCE
HazardavoidancefeaturesavailablefortheG1000aredesignedtoaidsituationalawarenessandprovideadvisory information with regard to potential hazards to flight safety associated with weather, terrain, and air traffic.
Weather
•GDL 69A XM® Satellite Weather
•L-3 STORMSCOPE® WX-500 Series II Weather Mapping Sensor (Optional)
Terrain Avoidance
•Terrain Proximity
•Terrain Awareness and Warning System (TAWS) (Optional)
Traffic
•Traffic Information Service (TIS)
•Honeywell® KTA 870 Traffic Advisory System (TAS) (Optional)
•Automatic Dependent Surveillance - Broadcast (ADS-B) Traffic (Optional)
6.1 XM SATELLITE WEATHER
 NOTE: XM Satellite Weather data provides information for avoiding hazardous weather. Do not utilize XM Weather information to penetrate hazardous weather.
XM Satellite Weather is provided through the GDL 69A, a remote-mounted data-link satellite receiver. Received graphical weather information and associated text is displayed on the Multi Function Display (MFD) and the Primary Flight Display (PFD) Inset Map. The GDL 69A can also receive XM Satellite Radio® entertainment services. Both weather data and entertainment programming operate in the S-band frequency range to provide continuous reception capabilities at any altitude throughout North America.
XM Satellite Radio services are subscription-based. For more information on specific service packages, visit www.xmradio.com.
190-00498-03 Rev.A |
Garmin G1000 Pilot’s Guide for Cessna Nav III |
6-1 |
HAZARD AVOIDANCE
ACTIVATING SERVICES
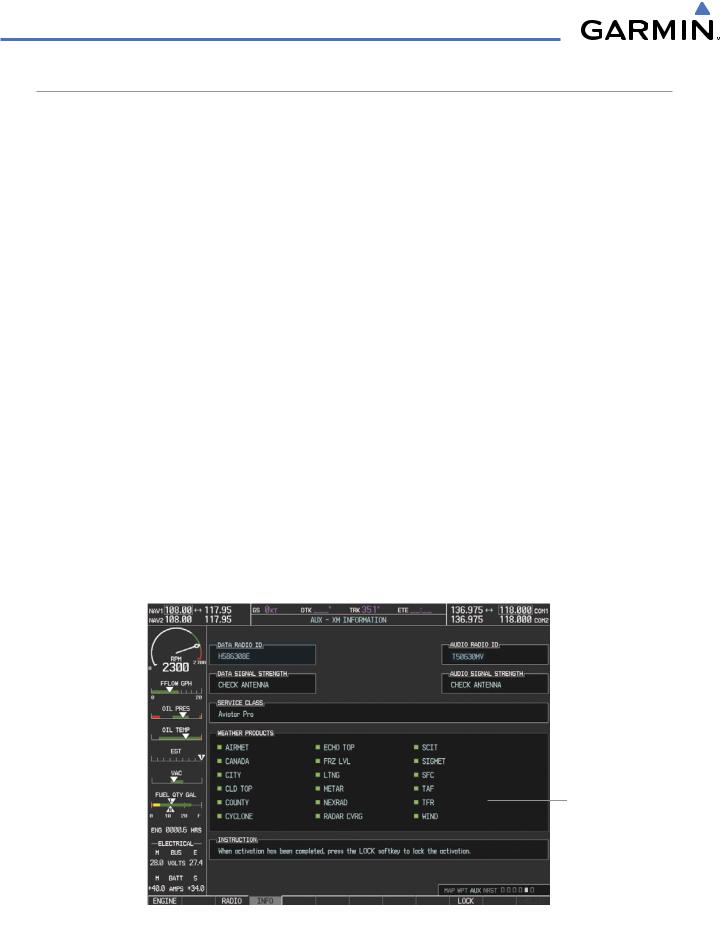
Before XM Satellite Weather can be used, the service must be activated. Service is activated by providing XM Satellite Radio with coded IDs unique to the installed GDL 69A. XM Satellite Radio and XM Satellite Weather services each have coded IDs. The Data and Audio Radio IDs must be provided to XM Satellite Radio to activate the weather service and entertainment subscriptions, respectively. These IDs are located on:
•The label on the back of the Data Link Receiver
•The XM Information Page on the MFD (Figure 6-1)
•The XM Satellite Radio Activation Instructions included with the unit (available at www.garmin.com, P/N 190-00355-04)
Contact the installer if the Audio and Data Radio IDs cannot be located.
XM Satellite Radio uses the coded IDs to send an activation signal that allows the G1000 to display weather data and/or entertainment programming provided through the GDL 69A.
Activating XM Satellite Weather and XM Satellite Radio services:
1)Contact XM Satellite Radio by email (address listed on their website, www.xmradio.com) or by the customer service phone number listed on the website. Follow the instructions provided by XM Satellite Radio services.
2)Select the fifth page in the Auxiliary Page Group.
3)Press the INFO Softkey to display the XM Information Page.
4)Verify that the desired services are activated.
5)Press the LOCK Softkey.
6)Turn the large FMS Knob to highlight ‘YES’.
7)To complete activation, press the ENT Key.
Data Radio ID |
|
Audio Radio ID |
||
|
|
|
|
|
(for XM Weather) |
|
(for XM Satellite Radio) |
||
Weather Products
(Available Products for Service Class Indicated in Green)
Select to Display XM |
|
Select to Lock |
||
|
||||
|
|
|
|
|
Information page |
|
Subscription Information |
||
|
|
Figure 6-1 XM Information Page |
||
6-2 |
Garmin G1000 Pilot’s Guide for Cessna Nav III |
190-00498-03 Rev.A |

HAZARD AVOIDANCE
USING XM SATELLITE WEATHER PRODUCTS
The primary map for viewing XM Weather data is the Weather Data Link Page in the Map Page Group. This is the only G1000 map display capable of showing information for all available XM weather products.
Viewing the Weather Data Link Page:
1)Turn the large FMS Knob to select the Map Page Group.
2)Turn the small FMS Knob to select the Weather Data Link Page.
NEXRAD Weather
Product Age
NEXRAD Weather
 Product Display Enabled
NEXRAD Weather Product
Selected for Display
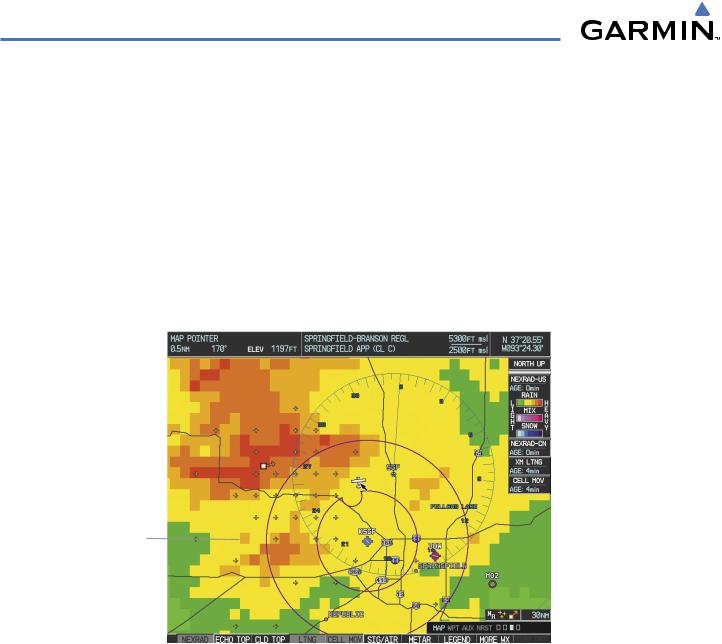
Figure 6-2 Weather Data Link Page
When a weather product is active on the Weather Data Link Page or the Navigation Map Page, the age of the data is displayed on the screen (Figure 6-2). The age of the product is based on the time difference between when the data was assembled on the ground and the current GPS time. Weather products are refreshed at specific intervals (defined in the Refresh Rate column in Table 6-1).
If for any reason, a weather product is not refreshed within the 30-, 60-, or 90-minute Expiration Time intervals (see Table 6-1), the data is considered expired and is removed from the display. This ensures that the displayed data is consistent with what is currently being broadcast by XM Satellite Radio services. If more than half of the expiration time has elapsed, the color of the product age displayed changes to yellow.
190-00498-03 Rev.A |
Garmin G1000 Pilot’s Guide for Cessna Nav III |
6-3 |
HAZARD AVOIDANCE
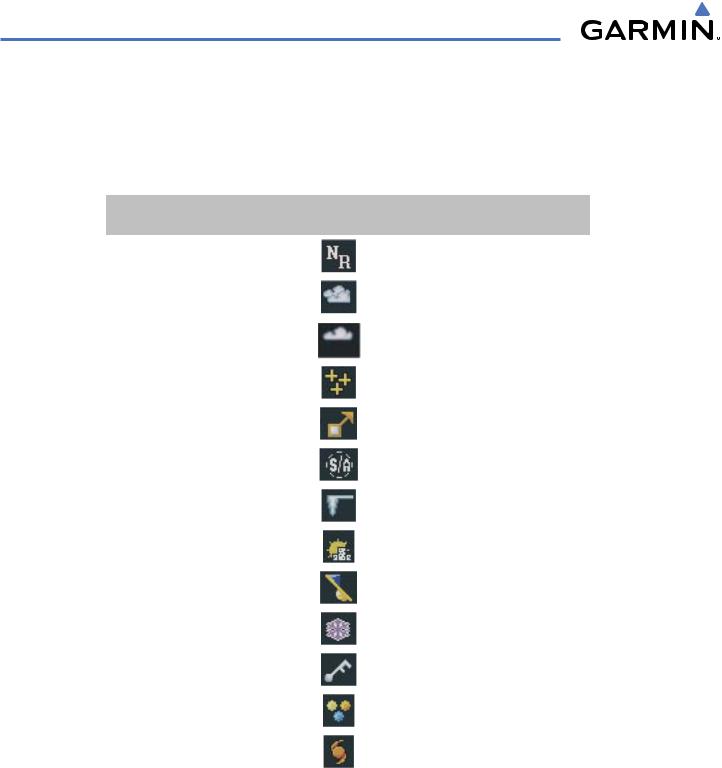
Table 6-1 shows the weather product symbols, the expiration time and the refresh rate. The refresh rate represents the interval at which XM Satellite Radio broadcasts new signals that may or may not contain new weather data. It does not represent the rate at which weather data is updated or new content is received by the Data Link Receiver. Weather data is updated at intervals that are defined and controlled by XM Satellite Radio and its data vendors.
Weather Product |
Symbol |
Expiration Time |
Refresh Rate |
|
(Minutes) |
(Minutes) |
|||
|
|
|||
Next-generation Radar |
|
30 |
5 |
|
(NEXRAD) |
|
|||
|
|
|
||
Cloud Top |
|
60 |
15 |
|
(CLD TOP) |
|
|||
|
|
|
||
Echo Top |
|
30 |
7.5 |
|
(ECHO TOP) |
|
|||
|
|
|
||
|
|
|
|
|
XM Lightning |
|
30 |
5 |
|
(LTNG) |
|
|||
|
|
|
||
Cell Movement |
|
30 |
12 |
|
(CELL MOV) |
|
|||
|
|
|
||
SIGMETs/AIRMETs |
|
60 |
12 |
|
(SIG/AIR) |
|
|||
|
|
|
||
Meteorological Aerodrome Report |
|
90 |
12 |
|
(METARs) |
|
|||
|
|
|
||
City Forecast |
|
60 |
12 |
|
(CITY) |
|
|||
|
|
|
||
Surface Analysis |
|
60 |
12 |
|
(SFC) |
|
|||
|
|
|
||
Freezing Levels |
|
60 |
12 |
|
(FRZ LVL) |
|
|||
|
|
|
||
Winds Aloft |
|
60 |
12 |
|
(WIND) |
|
|||
|
|
|
||
County Warnings |
|
60 |
5 |
|
(COUNTY) |
|
|||
|
|
|
||
Cyclone Warnings |
|
60 |
12 |
|
(CYCLONE) |
|
|||
|
|
|
||
|
|
|
|
|
Radar Coverage |
no product image |
30 |
5 |
|
(RADAR CVRG) |
||||
|
|
|
||
Temporary Flight Restrictions |
no product image |
60 |
12 |
|
(TFRs) |
||||
|
|
|
||
Terminal Aerodrome Reports |
no product image |
60 |
12 |
|
(TAFs) |
||||
|
|
|
||
Table 6-1 Weather Product Symbols and Data Timing |
|
|||
6-4 |
Garmin G1000 Pilot’s Guide for Cessna Nav III |
190-00498-03 Rev.A |
HAZARD AVOIDANCE
Table 6-2 shows which XM products can be displayed (indicated with a ‘+’ symbol) on specific maps.
Weather Product
NEXRAD
Cloud Top (CLD TOP)
Echo Top (ECHO TOP)
XM Lightning (LTNG)
Cell Movement (CELL MOV)
SIGMETs/AIRMETs (SIG/AIR)
METARs
City Forecast (CITY)
Surface Analysis (SFC)
Freezing Levels (FRZ LVL)
Winds Aloft (WIND)
County Warnings (COUNTY)
Cyclone Warnings (CYCLONE)
Radar Coverage
TFRs
TAFs
PFD Inset Map |
Navigation Map Page |
Weather Data Link Page |
Weather Information Page |
AUX - Trip Planning Page |
Nearest Page Group |
Flight Plan Pages |
+ |
+ |
+ |
|
+ |
+ |
+ |
|
|
+ |
|
|
|
|
|
|
+ |
|
|
|
|
+ |
+ |
+ |
|
+ |
+ |
+ |
+ |
+ |
+ |
|
+ |
+ |
+ |
|
|
+ |
|
|
|
|
|
|
+ |
+ |
|
|
|
|
|
+ |
|
|
|
|
|
|
+ |
|
|
|
|
|
|
+ |
|
|
|
|
|
|
+ |
|
|
|
|
|
|
+ |
|
|
|
|
|
|
+ |
|
|
|
|
|
+ |
+ |
|
|
|
|
+ |
+ |
+ |
+ |
+ |
+ |
+ |
|
|
+ |
+ |
|
|
|
|
|
|
|
|
|
|
Table 6-2 Weather Product Display Maps
190-00498-03 Rev.A |
Garmin G1000 Pilot’s Guide for Cessna Nav III |
6-5 |
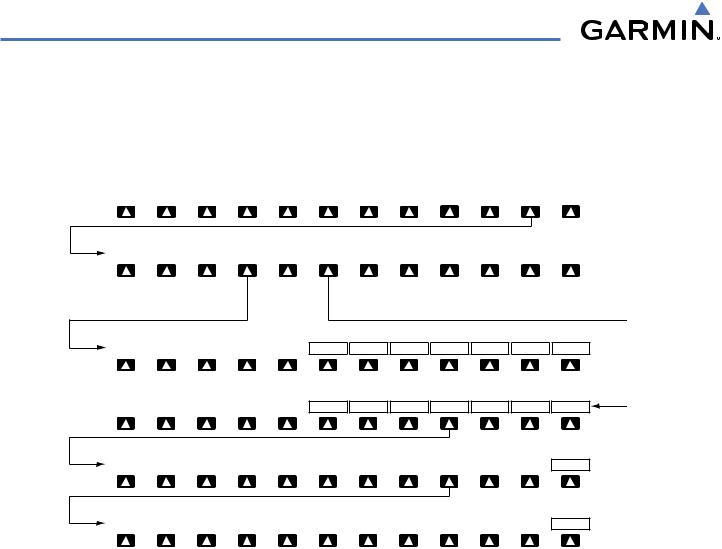
HAZARD AVOIDANCE
Softkeys control the display of weather information on most MFD pages and the PFD Inset Map (Figure 6-3 shows the weather product softkeys for the Weather Data Link Page). When a weather product is selected for display, the corresponding softkey label changes to gray to indicate the product is enabled. Unavailable weather products have subdued softkey labels (softkeys are disabled from selection).
ENGINE |
|
|
|
NEXRAD |
|
ECHO TOP |
|
|
|
LTNG |
|
|
|
|
|
|
|
MORE WX |
|
CHKLIST |
|
|
|
|
CLD TOP |
|
|
CELL MOV |
|
SIG/AIR |
|
METAR |
|
LEGEND |
|
||||||
|
|
|
|
|
|
|
|
|
|
|
|
|
|
|
|
|
|
|
|
|
|
|
|
|
|
|
SFC OFF |
FRZ LVL |
|
WIND OFF |
COUNTY |
|
CYCLONE |
|
|
|
LEGEND |
BACK |
|
|
|
SFC Softkey label changes to reflect current selection.
|
|
|
OFF |
CURRENT |
12 HR |
|
|
|
|
|
|
PREV |
OFF |
|
SFC |
3000 |
6000 |
WIND Softkey label changes |
Press the BACK Softkey to |
to reflect current selection. |
move up one level. |
24 HR |
36 HR |
48 HR |
|
LEGEND |
BACK |
9000 |
12000 |
15000 |
NEXT |
LEGEND |
BACK |
PREV |
OFF |
|
18000 |
21000 |
24000 |
27000 |
30000 |
33000 |
NEXT |
LEGEND |
BACK |
|
|
|
|
|
|
|
|
|
|
|
|
PREV |
OFF |
|
36000 |
39000 |
42000 |
|
|
|
NEXT |
LEGEND |
BACK |
Figure 6-3 Weather Data Link Weather Product Softkeys
The setup menus for the Navigation Map Page and the Weather Data Link Page control the map range settings above which weather products data are decluttered from the display. If a map range larger than the weather product map range setting is selected, the weather product data is removed from the map. The menus also provide a means in addition to the softkeys for enabling/disabling display of weather products.
6-6 |
Garmin G1000 Pilot’s Guide for Cessna Nav III |
190-00498-03 Rev.A |
HAZARD AVOIDANCE
Setting up and customizing the Weather Data Link Page:
1)Select the Weather Data Link Page.
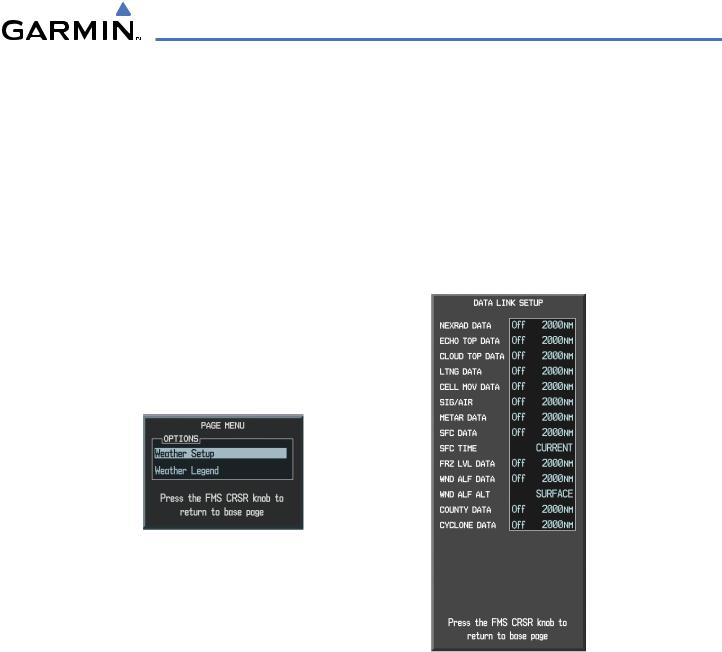
2)Press the MENU Key.
3)With ‘Weather Setup’ highlighted, press the ENT Key (Figure 6-4).
4)Turn the large FMS Knob or press the ENT Key to scroll though product selections (Figure 6-5).
5)Turn the small FMS Knob to scroll though options for each product (ON/OFF, range settings, etc.).
6)Press the ENT Key to select an option.
7)Press the FMS Knob or CLR Key to return to the Weather Data Link Page with the changed settings.
Figure 6-4 Weather Data Link Page Menu
Figure 6-5 Weather Data Link Page Setup Menu
Restoring default Weather Data Link Page settings:
1)Select the Weather Data Link Page.
2)Press the MENU Key.
3)With ‘Weather Setup’ highlighted, press the ENT Key.
4)Press the MENU Key.
5)Highlight the desired option to restore defaults (for all or for selection), and press the ENT Key.
190-00498-03 Rev.A |
Garmin G1000 Pilot’s Guide for Cessna Nav III |
6-7 |
HAZARD AVOIDANCE
Weather displayed on Pages other than the Weather Data Link Page use settings based on those selected for the Navigation Map Page.
Setting up and customizing weather data for the Navigation Map Page:
1)Select the Navigation Map Page.
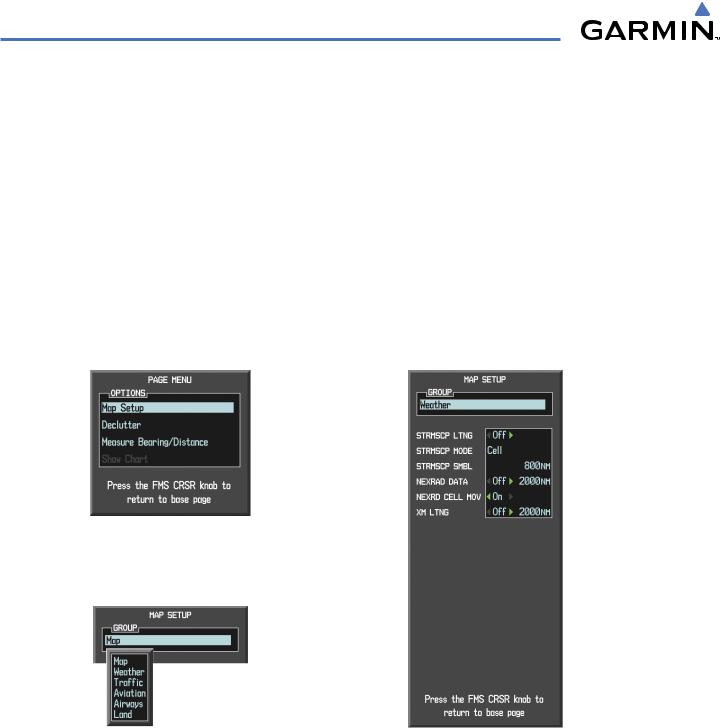
2)Press the MENU Key.
3)With ‘Map Setup’ highlighted, press the ENT Key (Figure 6-6).
4)Turn the small FMS Knob to select the ‘Weather’ Group and press the ENT Key (Figure 6-7).
5)Turn the large FMS Knob or press the ENT Key to scroll though product selections (Figure 6-8).
6)Turn the small FMS Knob to scroll though options for each product (ON/OFF, range settings).
7)Press the ENT Key to select an option.
8)Press the FMS Knob or CLR Key to return to the Navigation Map Page with the changed settings.
Figure 6-6 Navigation Map Page Menu
Figure 6-7 Navigation Map Page Setup Menu |
Figure 6-8 Navigation Map Page Setup Menu,Weather Group |
6-8 |
Garmin G1000 Pilot’s Guide for Cessna Nav III |
190-00498-03 Rev.A |
HAZARD AVOIDANCE
Each active weather product has an associated legend which can be displayed on the Weather Data Link Page.
Viewing legends for displayed weather products
1)Select the Weather Data Link Page.
2)Press the LEGEND Softkey to display the legends for the displayed weather products.
Or:
a)Press the MENU Key.
b)Select ‘Weather Legend’ and press the ENT Key.
3)Turn the FMS Knob to scroll through the legends if more are available than fit in the window.
4)To remove the Legend Window, press the LEGEND Softkey, the ENT or the CLR Key, or press the FMS Knob.
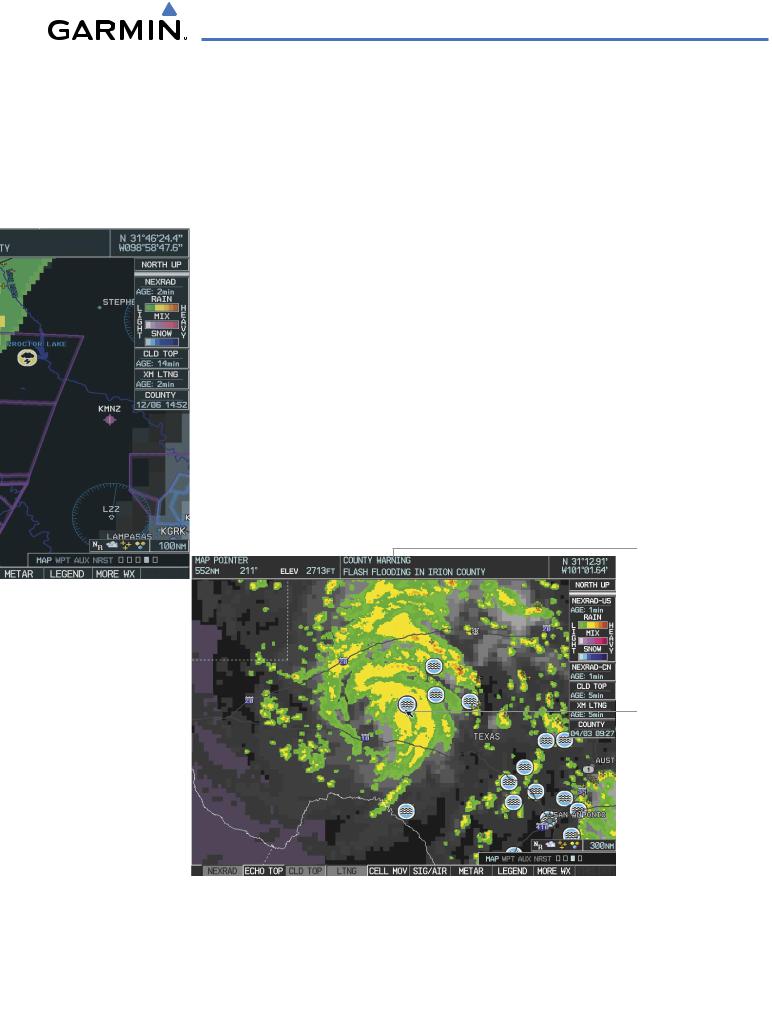
Additional information about the following can be displayed by panning over the display on the map:
• Echo Tops |
• METARs |
• Cell Movement |
• County Warnings |
• SIGMETs |
• TFRs |
• AIRMETs |
|
The map panning feature is enabled by pressing the RANGE Knob. The map range is adjusted by turning the RANGE Knob. If the map range is adjusted while panning is enabled, the map is re-centered on the Map Pointer.
Additional Information on Weather Feature Selected with Map Pointer
Flash Flood
Warning
Selected with
Map Pointer
Figure 6-9 Panning on the Weather Data Link Page
190-00498-03 Rev.A |
Garmin G1000 Pilot’s Guide for Cessna Nav III |
6-9 |
HAZARD AVOIDANCE
NEXRAD
 NOTE: NEXRAD cannot be displayed at the same time as map topography and/or terrain.
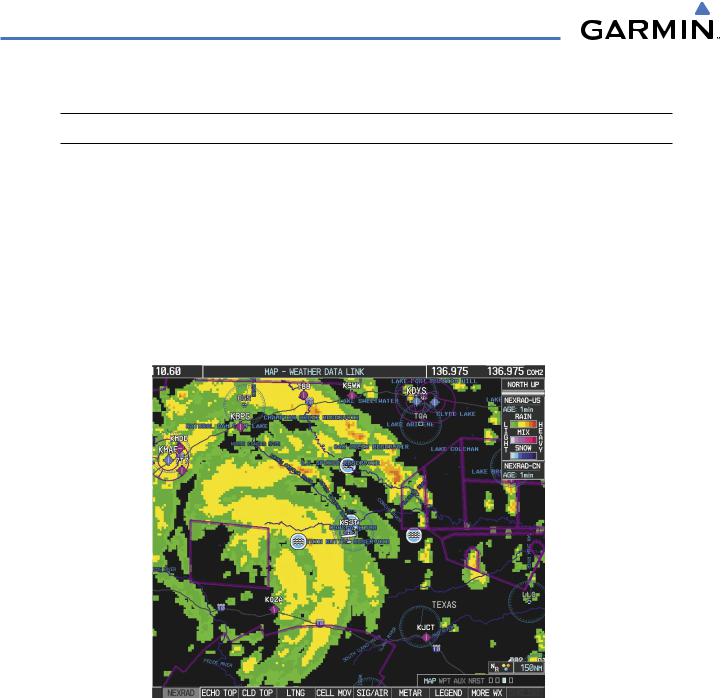
WSR-88D, or NEXRAD (NEXt-generation RADar), is a network of 158 high-resolution Doppler radar systems that are operated by the National Weather Service (NWS). NEXRAD data provides centralized meteorological information for the continental United States and selected overseas locations. The maximum range of a single NEXRAD radar site is 250 nm. In addition to a wide array of services, the NEXRAD network provides important information about severe weather and air traffic safety.
NEXRAD data is not real-time. The lapsed time between collection, processing, and dissemination of NEXRAD images can be significant and may not reflect the current radar synopsis. Due to the inherent delays and the relative age of the data, it should be used for long-range planning purposes only. Never use NEXRAD data or any radar data to penetrate hazardous weather. Rather, use it in an early-warning capacity of predeparture and enroute evaluation.
Figure 6-10 NEXRAD Data on the Weather Data Link Page |
|
NEXRAD data can be displayed on the following maps: |
|
• PFD Inset Map |
• Trip Planning Page |
• Navigation Map Page |
• Nearest Pages |
• Weather Data Link Page |
• Flight Plan Pages |
• Airport Information Page |
|
6-10 |
Garmin G1000 Pilot’s Guide for Cessna Nav III |
190-00498-03 Rev.A |
HAZARD AVOIDANCE
Displaying NEXRAD weather information:
1)Press the MAP Softkey (for the PFD Inset Map, press the INSET Softkey). This step is not necessary on the Weather Data Link Page.
2)Press the NEXRAD Softkey.
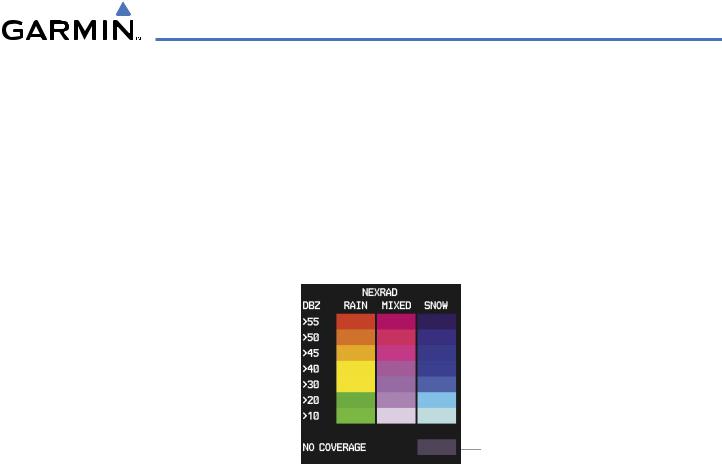
Composite data from all the NEXRAD radar sites in the United States is shown. This data is composed of the maximum reflectivity from the individual radar sweeps. The display of the information is color-coded to indicate the weather severity level. All weather product legends can be viewed on the Weather Data Link Page. For the NEXRAD legend (Figure 6-11), press the LEGEND Softkey when NEXRAD is selected for display.
No Radar Coverage
Figure 6-11 NEXRAD Data with Legend
The display of radar coverage is always active when either NEXRAD or ECHO TOPS is selected. Areas where NEXRAD radar coverage and Echo Tops information is not currently available or is not being collected are indicated in grayish-purple. Radar capability exists in these areas, but it is not active or is off-line.
REFLECTIVITY
Reflectivity is the amount of transmitted power returned to the radar receiver. Colors on the NEXRAD display are directly correlative to the level of detected reflectivity. Reflectivity as it relates to hazardous weather can be very complex.
The role of radar is essentially to detect moisture in the atmosphere. Simply put, certain types of weather reflect radar better than others. The intensity of a radar reflection is not necessarily an indication of the weather hazard level. For instance, wet hail returns a strong radar reflection, while dry hail does not. Both wet and dry hail can be extremely hazardous.
The different NEXRAD echo intensities are measured in decibels (dB) relative to reflectivity (Z). NEXRAD measures the radar reflectivity ratio, or the energy reflected back to the radar receiver (designated by the letter Z). The value of Z increases as the returned signal strength increases.
190-00498-03 Rev.A |
Garmin G1000 Pilot’s Guide for Cessna Nav III |
6-11 |
HAZARD AVOIDANCE
NEXRAD LIMITATIONS
NEXRAD radar images may have certain limitations:
•NEXRADbasereflectivitydoesnotprovidesufficientinformationtodeterminecloudlayersorprecipitation characteristics (wet hail vs. rain). For example, it is not possible to distinguish between wet snow, wet hail, and rain.
•NEXRAD base reflectivity is sampled at the minimum antenna elevation angle. An individual NEXRAD site cannot depict high altitude storms at close ranges. It has no information about storms directly over the site.
•When zoomed in to a range of 30 nm, each square block on the display represents an area of four square kilometers. The intensity level reflected by each square represents the highest level of NEXRAD data sampled within the area (Figure 6-12).
Block Area is 4 km2
Figure 6-12 NEXRAD Data - Zoomed
The following may cause abnormalities in displayed NEXRAD radar images:
•Ground clutter
•Strobes and spurious radar data
•Sun strobes (when the radar antenna points directly at the sun)
•Interference from buildings or mountains, which may cause shadows
•Metallic dust from military aircraft, which can cause alterations in radar scans
6-12 |
Garmin G1000 Pilot’s Guide for Cessna Nav III |
190-00498-03 Rev.A |

HAZARD AVOIDANCE
NEXRAD LIMITATIONS (CANADA)
•Radar coverage extends to 55ºN.
•Any precipitation displayed between 52ºN and 55ºN is displayed as mixed because it is unknown.
No coverage above 55ºN
Precipitation
above 52ºN
Figure 6-13 NEXRAD Data - Canada
190-00498-03 Rev.A |
Garmin G1000 Pilot’s Guide for Cessna Nav III |
6-13 |
HAZARD AVOIDANCE
ECHO TOPS
 NOTE: Display of Echo Tops is mutually exclusive with Cloud Tops and NEXRAD.
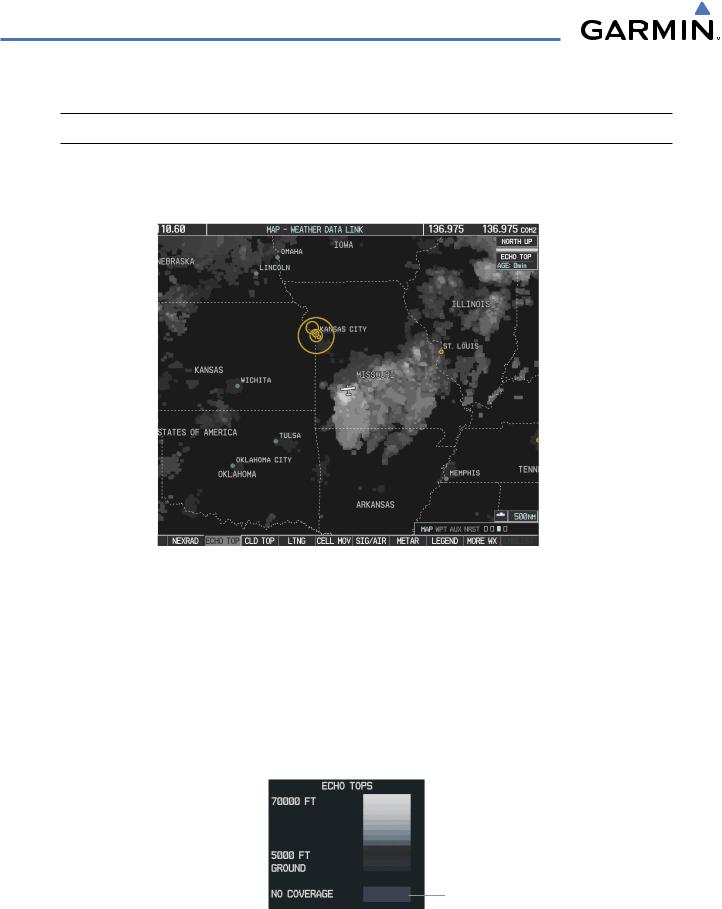
Echo Tops data (Figure 6-14) shows the location, elevation, and direction of the highest radar echo. The highest radar echo does not indicate the top of a storm or clouds; rather it indicates the highest altitude at which precipitation is detected. Information is derived from NEXRAD data.
Figure 6-14 Echo Tops Data
Displaying Echo Tops information:
1)Select the Weather Data Link Page.
2)Press the ECHO TOPS Softkey.
To display the Echo Tops legend (Figure 6-15), press the LEGEND Softkey when Echo Tops is selected for display. Since Echo Tops and Cloud Tops use the same color scaling to represent altitude, display of these weather products is mutually exclusive. When Echo Tops is activated, NEXRAD and Cloud Tops data are removed.
No Radar Coverage
Figure 6-15 ECHO TOPS Legend
6-14 |
Garmin G1000 Pilot’s Guide for Cessna Nav III |
190-00498-03 Rev.A |
HAZARD AVOIDANCE
The display of radar coverage is always active when either NEXRAD or ECHO TOPS is selected. Areas where NEXRAD radar coverage and Echo Tops information is not currently available or is not being collected are indicated in grayish-purple. Radar capability exists in these areas, but it is not active or is off-line.
CLOUD TOPS
 NOTE: Cloud Tops and Echo Tops cannot be displayed at the same time.
Cloud Tops data (Figure 6-16) depicts cloud top altitudes as determined from satellite imagery.
Figure 6-16 Cloud Tops Data
Displaying Cloud Tops information:
1)Select the Weather Data Link Page.
2)Press the CLOUD TOPS Softkey.
To display the Cloud Tops legend (Figure 6-17), press the LEGEND Softkey when Cloud Tops is selected for display. Since Cloud Tops and Echo Tops use the same color scaling to represent altitude, display of these weather products is mutually exclusive. When Cloud Tops is activated, Echo Tops data is removed.
Figure 6-17 Cloud Tops Legend
190-00498-03 Rev.A |
Garmin G1000 Pilot’s Guide for Cessna Nav III |
6-15 |
HAZARD AVOIDANCE
XM LIGHTNING
 NOTE: XM Lightning and optional L-3 STORMSCOPE® WX-500 Lightning are mutually exclusive.
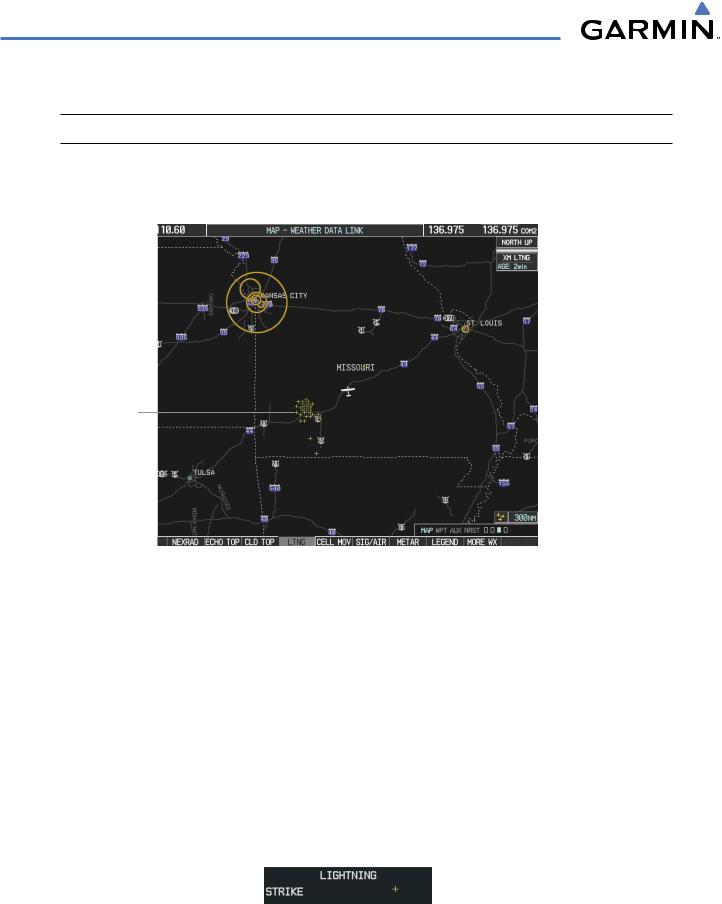
Lightning data (Figure 6-18) shows the approximate location of cloud-to-ground lightning strikes. A strike icon represents a strike that has occurred within a two-kilometer region. The exact location of the lightning strike is not displayed.
Lightning
Strikes
Figure 6-18 |
Lightning Data |
XM Lightning data displays on the following maps: |
|
• PFD Inset Map |
• Trip Planning Page |
• Navigation Map Page |
• Nearest Pages |
• Weather Data Link Page |
• Flight Plan Pages |
Displaying XM Lightning information:
1)Press the MAP Softkey (for the PFD Inset Map, press the INSET Softkey). This step is not necessary on the Weather Data Link Page.
2)Press the XM LTNG Softkey (LTNG Softkey on the Weather Data Link Page).
To display the XM Lightning legend on the Weather Data Link Page (Figure 6-19), press the LEGEND Softkey when XM Lightning is selected for display.
Figure 6-19 Lightning Legend
6-16 |
Garmin G1000 Pilot’s Guide for Cessna Nav III |
190-00498-03 Rev.A |

HAZARD AVOIDANCE
CELL MOVEMENT
Cell Movement data (Figure 6-20) shows the location and movement of storm cells as identified by the ground-based system. Cells are represented by yellow squares, with direction of movement indicated with short, orange arrows.
Storm Cells
Figure 6-20 Cell Movement Data
On most applicable maps, Cell Movement data is selected for display along with NEXRAD. On the Weather Data Link Page, Cell Movement data can be selected independently. Cell Movement data can be displayed on the following maps:
• PFD Inset Map |
• AUX - Trip Planning Page |
•Navigation Map |
• Nearest Pages |
Displaying Cell Movement information:
1)Press the MAP Softkey (for the PFD Inset Map, press the INSET Softkey). This step is not necessary on the Weather Data Link Page.
2)Press the NEXRAD Softkey (CEL MOV Softkey on the Weather Data Link Page). For Cell Movement to be displayed on maps other than theWeather Data Link Page, Cell Movement must be turned on in the Navigation Map Setup Menu (see “Setting Up XM Satellite Weather”).
To display the Cell Movement legend on the Weather Data Link Page, (Figure 6-21), press the LEGEND Softkey when Cell Movement is selected for display.
Figure 6-21 Cell Movement Legend
190-00498-03 Rev.A |
Garmin G1000 Pilot’s Guide for Cessna Nav III |
6-17 |
HAZARD AVOIDANCE
SIGMETS AND AIRMETS
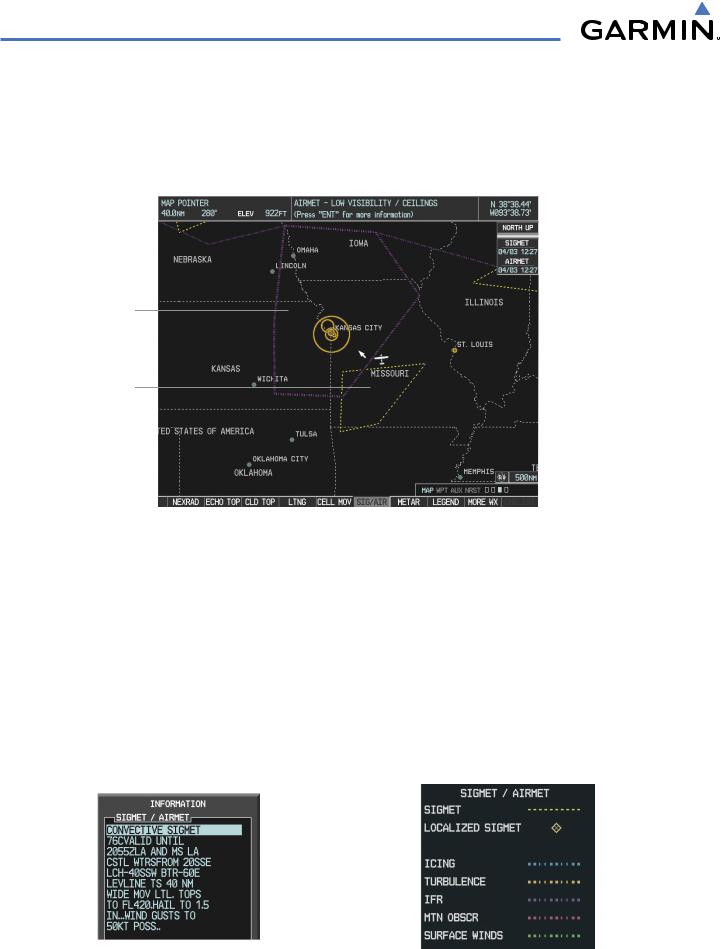
SIGMETs (SIGnificant METeorological Information) and AIRMETs (AIRmen’s METeorological Information) arebroadcastforpotentiallyhazardousweatherconsideredofextremeimportancetoallaircraft. AConvective SIGMET is issued for hazardous convective weather. A localized SIGMET is a significant weather condition occurring at a localized geographical position.
AIRMET
SIGMET
Figure 6-22 SIGMET/AIRMET Data
Displaying SIGMETs and AIRMETs:
1)Select the Weather Data Link Page.
2)Press the SIG/AIR Softkey.
3)To view the text of the SIGMET or AIRMET, press the RANGE Knob and move the Map Pointer over the icon.
4)Press the ENT key. Figure 6-23 shows sample SIGMET text.
To display the SIGMET and AIRMET legend (Figure 6-24), press the LEGEND Softkey when SIGMETs and AIRMETs are selected for display.
Figure 6-23 Sample SIGMET Text |
Figure 6-24 SIGMET/AIRMET Legend |
|
6-18 |
Garmin G1000 Pilot’s Guide for Cessna Nav III |
190-00498-03 Rev.A |
HAZARD AVOIDANCE
METARS AND TAFS
 NOTE: Atmospheric pressure as reported for METARs is given in hectopascals (hPa), except for in the United States, where it is reported in inches of mercury (in Hg). Temperatures are reported in Celsius.
 NOTE: METAR information is only displayed within the installed aviation database service area.
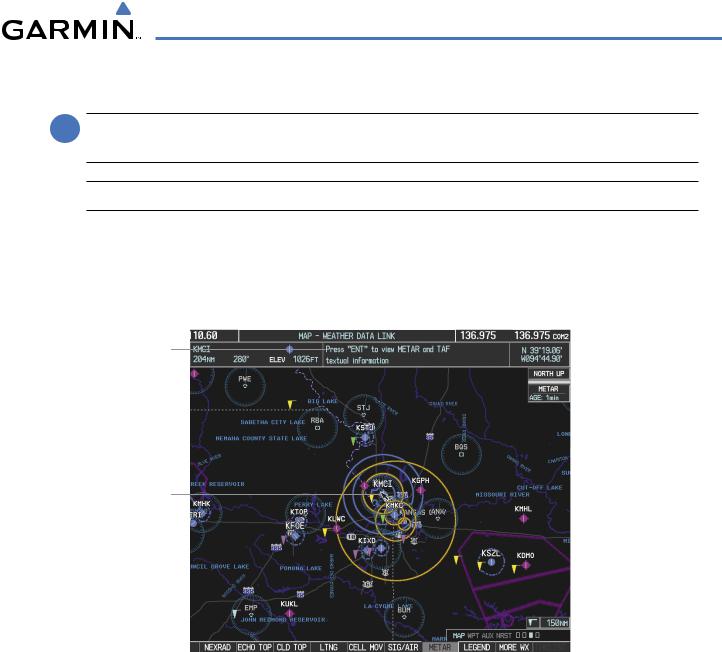
METAR (METeorological Aerodrome Report) is the standard format for pre-flight weather briefings. METARs are updated hourly and are considered current. METARs typically contain information about the temperature, dewpoint, wind, precipitation, cloud cover, cloud heights, visibility, and barometric pressure. They can also contain information on precipitation amounts, lightning, and other critical data. METARs are shown as colored flags at airports that provide them.
Instructions for Viewing
METAR and TAF Text
Selected Airport
Figure 6-25 METAR Flags on the Weather Data Link Page
TAF (Terminal Aerodrome Report) is the standard format for 24-hour weather forecasts. TAFs may contain some METAR data, but generally cover a smaller area. It typically forecasts significant weather changes, temporary changes, probable changes, and expected changes in weather conditions.
METAR and TAF text are displayed on the Weather Information Page. METAR data is displayed first in a decoded fashion, then as raw text. TAF information is displayed only in its raw form.
Displaying METAR and TAF text:
1)On the Weather Data Link Page, press the METAR Softkey.
2)Press the RANGE Knob and pan to the desired airport.
3)Press the ENT Key. The Weather Information Page is shown with METAR and TAF text.
190-00498-03 Rev.A |
Garmin G1000 Pilot’s Guide for Cessna Nav III |
6-19 |

HAZARD AVOIDANCE
4)Use the FMS Knob or the ENT Key to scroll through the METAR and TAF text. METAR text must be completely scrolled through before scrolling through the TAF text.
5)Press the FMS Knob or the CLR Key to return to the Weather Data Link Page.
Or:
1)Select the Weather Information Page.
a)Turn the large FMS Knob to select the Waypoint Page Group.
b)Press the WX Softkey to select the Weather Information Page.
2)Press the FMS Knob to display the cursor.
3)Use the FMS Knob to enter the desired airport and press the ENT Key.
4)Use the FMS Knob or the ENT Key to scroll through the METAR and TAF text. Note that the METAR text must be completely scrolled through before scrolling through the TAF text.
METAR Text for the
Selected Airport
METAR Symbol |
TAF Text for the |
|
|
||
|
|
|
|
Selected Airport |
|
Figure 6-26 METAR and TAF Text on the Weather Information Page
To display the METAR legend on the Weather Data Link Page (Figure 6-27), press the LEGEND Softkey when METARs are selected for display.
The METAR flag color is determined by the information in the METAR text. A gray METAR flag is displayed when the METAR text does not contain adequate information.
Figure 6-27 METAR Legend
6-20 |
Garmin G1000 Pilot’s Guide for Cessna Nav III |
190-00498-03 Rev.A |

HAZARD AVOIDANCE
SURFACE ANALYSIS AND CITY FORECAST
 NOTE: Surface Analysis and City Forecast data are displayed only within the installed Aviation Database service area.
Surface Analysis and City Forecast information is available for current and forecast weather conditions. Forecasts are available for intervals of 12, 24, 36, and 48 hours.
Figure 6-28 Current Surface Analysis Data
Displaying Surface Analysis and City Forecast information:
1)Select the Weather Data Link Page.
2)Press the MORE WX Softkey.
3)Press the SFC Softkey.
4)Select the desired forecast time: CURRENT, 12 HR, 24 HR, 36 HR, or 48 HR. The SFC Softkey label changes to reflect the forecast time selected.
To display the Surface Analysis and City Forecast legend (Figure 2-29), press the LEGEND Softkey when Surface Analysis and City Forecast are selected to be displayed.
Figure 6-29 Surface Analysis Legend
190-00498-03 Rev.A |
Garmin G1000 Pilot’s Guide for Cessna Nav III |
6-21 |
HAZARD AVOIDANCE
FREEZING LEVELS
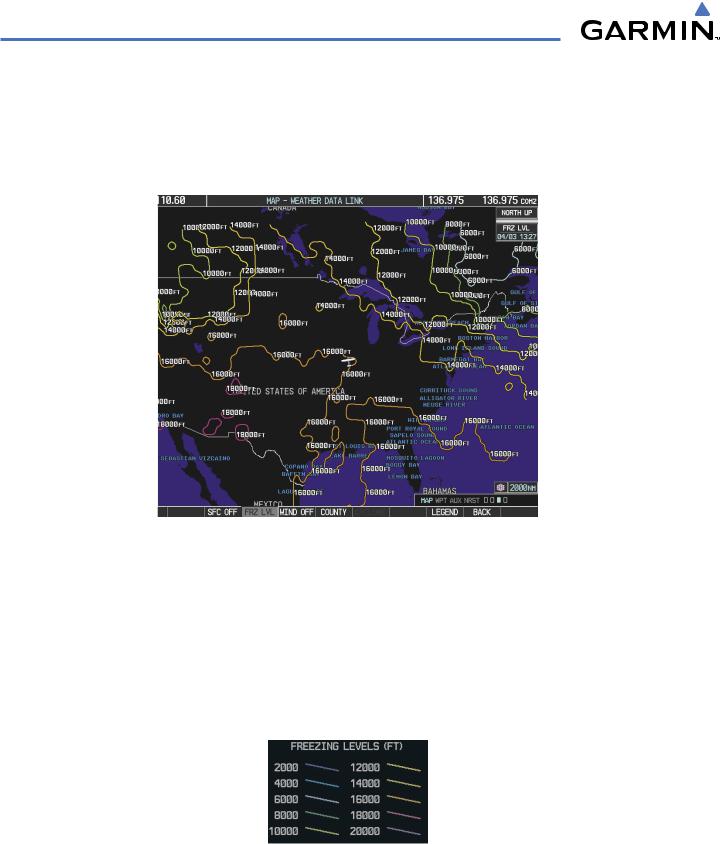
Freezing Level data shows the color-coded contour lines for the altitude and location at which the first isotherm is found (Figure 6-30). When no data is displayed for a given altitude, the data for that altitude has not been received, or is out of date and has been removed from the display. New data appears at the next update.
Figure 6-30 Freezing Level Data
Displaying Freezing Level information:
1)Select the Weather Data Link Page.
2)Press the MORE WX Softkey.
3)Press the FRZ LVL Softkey.
To display the Freezing Level legend (Figure 6-31), press the LEGEND Softkey when Freezing Level data is selected to be displayed.
Figure 6-31 Freezing Level Legend
6-22 |
Garmin G1000 Pilot’s Guide for Cessna Nav III |
190-00498-03 Rev.A |
HAZARD AVOIDANCE
WINDS ALOFT
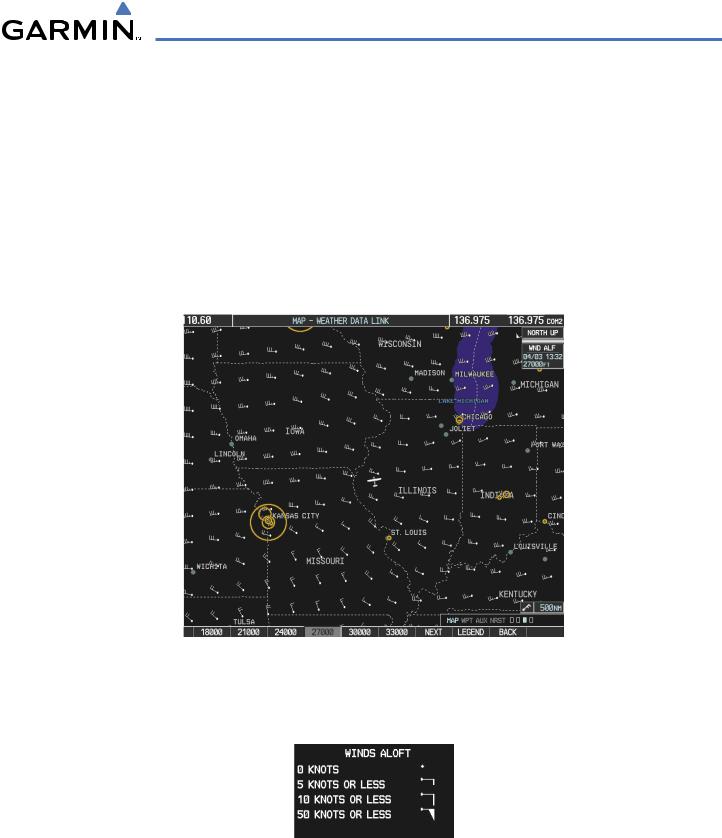
Winds Aloft data (Figure 6-32) shows the forecasted wind speed and direction at the surface and at selected altitudes. Altitude can be displayed in 3,000-foot increments up to 42,000 feet MSL.
Displaying Winds Aloft data:
1)Select the Weather Data Link Page.
2)Press the MORE WX Softkey.
3)Press the WIND Softkey.
4)Select the desired altitude level: SFC (surface) up to 42,000 feet. Press the NEXT or PREV Softkey to cycle through the altitude softkeys. The WIND Softkey label changes to reflect the altitude selected.
Figure 6-32 Winds Aloft Data at 27,000 Feet
To display the Winds Aloft legend (Figure 6-33), press the LEGEND Softkey when Winds Aloft is selected for display.
Figure 6-33 Winds Aloft Data with Legend
190-00498-03 Rev.A |
Garmin G1000 Pilot’s Guide for Cessna Nav III |
6-23 |

HAZARD AVOIDANCE
COUNTY WARNINGS
County data (Figure 6-34) provides specific public awareness and protection weather warnings from the National Weather Service (NWS). This can include information on fires, tornadoes, severe thunderstorms, flood conditions, and other natural disasters.
Additional Information on Flood Warning Selected with Map Pointer
Flood Warning
Figure 6-34 County Flood Warning
Displaying County Warning information:
1)Select the Weather Data Link Page.
2)Press the MORE WX Softkey.
3)Press the COUNTY Softkey.
To display the County Warnings legend (Figure 6-35), press the LEGEND Softkey when County Warnings are selected to be displayed.
Figure 6-35 County Warnings Legend
6-24 |
Garmin G1000 Pilot’s Guide for Cessna Nav III |
190-00498-03 Rev.A |
HAZARD AVOIDANCE
CYCLONE
The Cyclone weather product shows the current location of cyclones (hurricanes) and their projected tracks.
Cyclone
Figure 6-36 Cyclone Data Selected for Display
Displaying cyclone (hurricane) track information:
1)Select the Weather Data Link Page.
2)Press the MORE WX Softkey.
3)Press the CYCLONE Softkey.
To display the Cyclone legend (Figure 6-37), press the LEGEND Softkey when Cyclones are selected to be displayed.
Figure 6-37 Cyclone Legend
190-00498-03 Rev.A |
Garmin G1000 Pilot’s Guide for Cessna Nav III |
6-25 |