

18 |
CHAPTER 2: Appeasing the Tiki Gods |
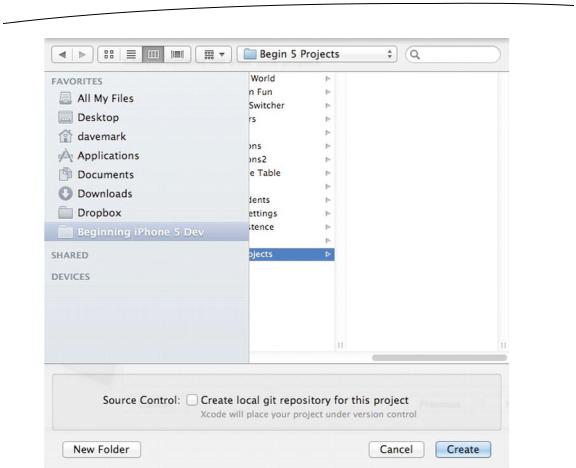
Figure 2–4. Saving your project in a project folder on your hard drive
The Xcode Workspace Window
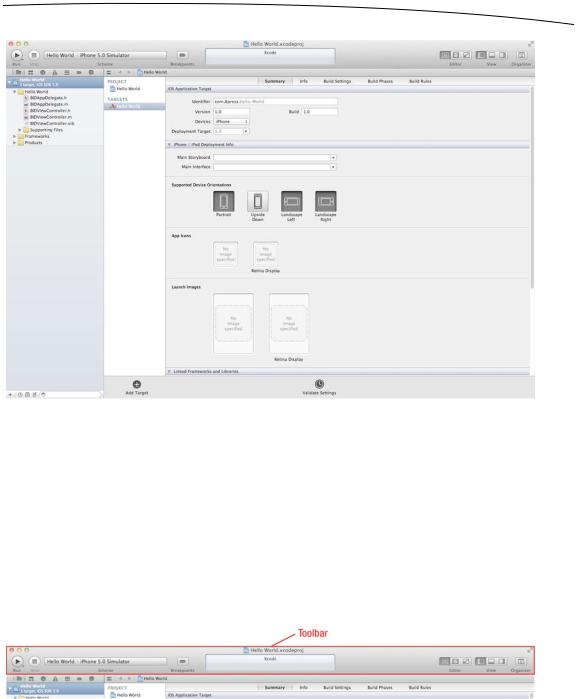
After you dismiss the save sheet, Xcode will create and then open your project. You will see a new workspace window, as shown in Figure 2–5. There’s a lot of information crammed into this window, and it’s where you will be spending a lot of your iOS development time.
www.it-ebooks.info
CHAPTER 2: Appeasing the Tiki Gods |
19 |
Figure 2–5. The Hello World project in Xcode
Even if you are an old hand with earlier versions of Xcode, you’ll still benefit from reading through this section, as a lot has changed since the last release of Xcode 3.x. Let’s take a quick tour.
The Toolbar
The top of the Xcode workspace window is called the toolbar (see Figure 2–6). On the left side of the toolbar are controls to start and stop running your project, a popup menu to select the scheme you want to run, and a button to toggle breakpoints on and off. A scheme brings together target and build settings, and the toolbar popup menu lets you select a specific setup with just one click.
Figure 2–6. The Xcode toolbar
The big box in the middle of the toolbar is the activity view. As its name implies, the activity view displays any actions or processes that are currently happening. For
www.it-ebooks.info

20 |
CHAPTER 2: Appeasing the Tiki Gods |
example, when you run your project, the activity view gives you a running commentary on the various steps it’s taking to build your application. If you encounter any errors or warnings, that information is displayed here as well. If you click the warning or error, you’ll go directly to the issues navigator, which provides more information about the warning or error, as described in the next section.
On the right side of the toolbar are three sets of buttons. The left set, labeled Editor, lets you switch between three different editor configurations:
The standard view gives you a single pane dedicated to editing a file or project-specific configuration values.
The incredibly powerful assistant view splits the editor pane into two panes, left and right. The pane on the right is generally used to display a file that relates to the file on the left, or that you might need to refer to while editing the file on the left. You can manually specify what goes into each pane, or you can let Xcode decide what’s most appropriate for the task at hand. For example, if you’re editing the implementation of an Objective-C class (the .m file), Xcode will automatically show you that class’s header file (the .h file) in the right pane. If you’re designing your user interface on the left, Xcode will show you the code that user interface is able to interact with on the right. You’ll see the assistant view at work throughout the book.
The versions button converts the editor pane into a time-machine-like comparison view that works with source code management systems such as Subversion and Git. You can compare the current version of a source file with a previously committed version or compare any two earlier versions with each other.
To the right of the editor button set is another set of buttons that show and hide the navigator pane and the utility pane, on the left and right side of the editor pane. Click those buttons to see these panes in action.
Finally, the rightmost button brings up the Organizer window, which is where you’ll find the bulk of nonproject-specific functionality. It’s used as the documentation viewer for Apple’s API documentation, shows you all the source code repositories that Xcode knows about, keeps a list of all projects you’ve opened, and maintains a list of all devices that you’ve synchronized with this computer.
www.it-ebooks.info
CHAPTER 2: Appeasing the Tiki Gods |
21 |
The Navigator View
Just below the toolbar, on the left side of the workspace window, is the navigator view. The navigator view offers seven configurations that give you different views into your project. Click one of the icons at the top of the navigator view to switch among the following navigators, going from left to right:
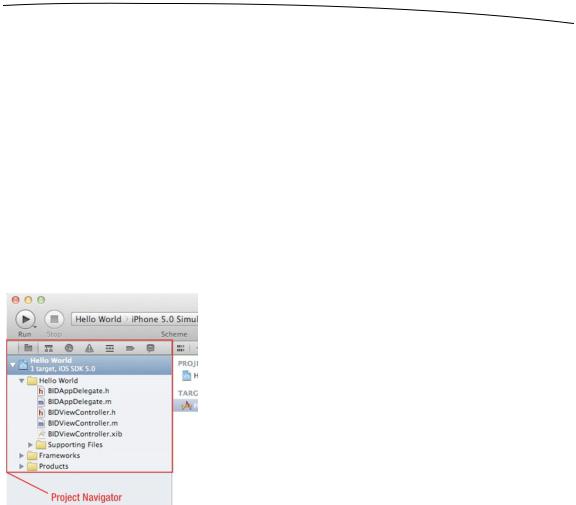
Project navigator: This view contains a list of files that are used by your project (see Figure 2–7). You can store references to everything you expect—from source code files to artwork, data models, property list (or plist) files (discussed in the “A Closer Look at Our Project” section later in this chapter), and even other project files. By storing multiple projects in a single workspace, multiple projects can easily share resources. If you click any file in the navigator view, that file will display in the editor pane. In addition to viewing the file, you can also edit the file (if it’s a file that Xcode knows how to edit).
Figure 2–7. The Xcode navigator view showing the project navigator. Click one of the seven icons at the top of the view to switch navigators.
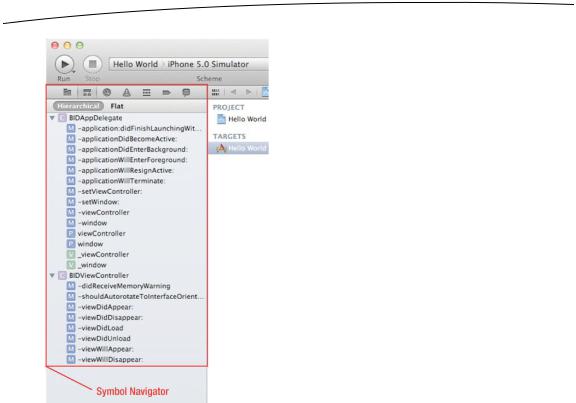
Symbol navigator: As its name implies, this navigator focuses on the symbols defined in the workspace (see Figure 2–8). Symbols are basically the items that the compiler recognizes, such as Objective-C classes, enumerations, structs, and global variables.
www.it-ebooks.info
22 |
CHAPTER 2: Appeasing the Tiki Gods |
Figure 2–8. The Xcode navigator view showing the symbol navigator. Open the disclosure triangle to explore the files and symbols defined within each group.
Search navigator: You’ll use this navigator to perform searches on all the files in your workspace (see Figure 2–9). You can select Replace from the Find popup menu, and do a search and replace on all or just selected portions of the search results. For richer searches, select Show Find Options from the popup menu tied to the magnifying glass in the search field.
www.it-ebooks.info

CHAPTER 2: Appeasing the Tiki Gods |
23 |
Figure 2–9. The Xcode navigator view showing the search navigator. Be sure to check out the popup menus hidden under the word Find and under the magnifying glass in the search field.
Issues navigator: When you build your project, any errors or warnings will appear in this navigator, and a message detailing the number of errors will appear in the activity view at the top of the window (see Figure 2–10). When you click an error in the issues navigator, you’ll jump to the appropriate line of code in the editor pane.
Figure 2–10. The Xcode navigator view showing the issues navigator. This is where you’ll find your compiler errors and warnings.
Debug navigator: This navigator is your main view into the debugging process (see Figure 2–11). If you are new to debugging, you might check out this part of the Xcode 4 User Guide:
http://developer.apple.com/library/mac/#documentation/
ToolsLanguages/Conceptual/Xcode4UserGuide/Debugging/Debugging.html
www.it-ebooks.info
24 |
CHAPTER 2: Appeasing the Tiki Gods |
The debug navigator lists the stack frame for each active thread. A stack frame is a list of the functions or methods that have been called previously, in the order they were called. Click a method, and the associated code appears in the editor pane. In the editor, there will be a second frame, where you can control the debugging process, display and modify data values, and access the low-level debugger. A slider at the bottom of the debug navigator allows you to control the level of detail it tracks. Slide to the extreme right to see everything, including all the system calls. Slide to the extreme left to see only your calls. The default setting of right in the middle is a good place to start.
Figure 2–11. The Xcode navigator view showing the debug navigator. Be sure to try out the detail slider at the bottom of the window, which allows you to specify the level of debug detail you want to see.
Breakpoint navigator: The breakpoint navigator lets you see all the breakpoints that you’ve set (see Figure 2–12). Breakpoints are, as the name suggests, points in your code where the application will stop running (or break), so that you can look at the values in variables and do other tasks needed to debug your application. The list of breakpoints in this navigator is organized by file. Click a breakpoint in the list, and that line will appear in the editor pane. Be sure to check out the popup at the lower-left corner of the workspace window when in the breakpoint navigator. The plus popup lets you add an exception or symbolic breakpoint, and the minus popup deletes any selected breakpoints.
www.it-ebooks.info