

- •Foreword
- •Preface
- •Is This Book for You?
- •How This Book Is Organized
- •How to Use This Book
- •Doing the Exercises
- •Conventions Used in This Book
- •What the Icons Mean
- •About the CD-ROM
- •Other Information
- •Contacting the Author
- •Acknowledgments
- •Contents at a Glance
- •Contents
- •Getting Acquainted with AutoCAD and AutoCAD LT
- •Starting AutoCAD and AutoCAD LT
- •Creating a New Drawing
- •Using the AutoCAD and AutoCAD LT Interface
- •Creating Your First Drawing
- •Saving a Drawing
- •Summary
- •Creating a New Drawing from a Template
- •Working with Templates
- •Opening a Drawing with Default Settings
- •Opening an Existing Drawing
- •Using an Existing Drawing as a Prototype
- •Saving a Drawing Under a New Name
- •Summary
- •The Command Line
- •Command Techniques
- •Of Mice and Pucks
- •Getting Help
- •Summary
- •Typing Coordinates
- •Displaying Coordinates
- •Picking Coordinates on the Screen
- •Locating Points
- •Summary
- •Unit Types
- •Drawing Limits
- •Understanding Scales
- •Inserting a Title Block
- •Common Setup Options
- •The MVSETUP Command
- •Summary
- •Using the LINE Command
- •Drawing Rectangles
- •Drawing Polygons
- •Creating Construction Lines
- •Creating Rays
- •Summary
- •Drawing Circles
- •Drawing Arcs
- •Creating Ellipses and Elliptical Arcs
- •Making Donuts
- •Placing Points
- •Summary
- •Panning
- •The ZOOM Command
- •Aerial View
- •Named Views
- •Tiled Viewports
- •Snap Rotation
- •User Coordinate Systems
- •Isometric Drawing
- •Summary
- •Editing a Drawing
- •Selecting Objects
- •Summary
- •Copying and Moving Objects
- •Using Construction Commands
- •Creating a Revision Cloud
- •Hiding Objects with a Wipeout
- •Double-Clicking to Edit Objects
- •Grips
- •Editing with the Properties Palette
- •Selection Filters
- •Groups
- •Summary
- •Working with Layers
- •Changing Object Color, Linetype, and Lineweight
- •Working with Linetype Scales
- •Importing Layers and Linetypes from Other Drawings
- •Matching Properties
- •Summary
- •Drawing-Level Information
- •Object-Level Information
- •Measurement Commands
- •AutoCAD’s Calculator
- •Summary
- •Creating Single-Line Text
- •Understanding Text Styles
- •Creating Multiline Text
- •Creating Tables
- •Inserting Fields
- •Managing Text
- •Finding Text in Your Drawing
- •Checking Your Spelling
- •Summary
- •Working with Dimensions
- •Drawing Linear Dimensions
- •Drawing Aligned Dimensions
- •Creating Baseline and Continued Dimensions
- •Dimensioning Arcs and Circles
- •Dimensioning Angles
- •Creating Ordinate Dimensions
- •Drawing Leaders
- •Using Quick Dimension
- •Editing Dimensions
- •Summary
- •Understanding Dimension Styles
- •Defining a New Dimension Style
- •Changing Dimension Styles
- •Creating Geometric Tolerances
- •Summary
- •Creating and Editing Polylines
- •Drawing and Editing Splines
- •Creating Regions
- •Creating Boundaries
- •Creating Hatches
- •Creating and Editing Multilines
- •Creating Dlines
- •Using the SKETCH Command
- •Digitizing Drawings with the TABLET Command
- •Summary
- •Preparing a Drawing for Plotting or Printing
- •Creating a Layout in Paper Space
- •Working with Plot Styles
- •Plotting a Drawing
- •Summary
- •Combining Objects into Blocks
- •Inserting Blocks and Files into Drawings
- •Managing Blocks
- •Using Windows Features
- •Working with Attributes
- •Summary
- •Understanding External References
- •Editing an Xref within Your Drawing
- •Controlling Xref Display
- •Managing Xrefs
- •Summary
- •Preparing for Database Connectivity
- •Connecting to Your Database
- •Linking Data to Drawing Objects
- •Creating Labels
- •Querying with the Query Editor
- •Working with Query Files
- •Summary
- •Working with 3D Coordinates
- •Using Elevation and Thickness
- •Working with the User Coordinate System
- •Summary
- •Working with the Standard Viewpoints
- •Using DDVPOINT
- •Working with the Tripod and Compass
- •Getting a Quick Plan View
- •Shading Your Drawing
- •Using 3D Orbit
- •Using Tiled Viewports
- •Defining a Perspective View
- •Laying Out 3D Drawings
- •Summary
- •Drawing Surfaces with 3DFACE
- •Drawing Surfaces with PFACE
- •Creating Polygon Meshes with 3DMESH
- •Drawing Standard 3D Shapes
- •Drawing a Revolved Surface
- •Drawing an Extruded Surface
- •Drawing Ruled Surfaces
- •Drawing Edge Surfaces
- •Summary
- •Drawing Standard Shapes
- •Creating Extruded Solids
- •Drawing Revolved Solids
- •Creating Complex Solids
- •Sectioning and Slicing Solids
- •Using Editing Commands in 3D
- •Editing Solids
- •Listing Solid Properties
- •Summary
- •Understanding Rendering
- •Creating Lights
- •Creating Scenes
- •Working with Materials
- •Using Backgrounds
- •Doing the Final Render
- •Summary
- •Accessing Drawing Components with the DesignCenter
- •Accessing Drawing Content with Tool Palettes
- •Setting Standards for Drawings
- •Organizing Your Drawings
- •Working with Sheet Sets
- •Maintaining Security
- •Keeping Track of Referenced Files
- •Handling Errors and Crashes
- •Managing Drawings from Prior Releases
- •Summary
- •Importing and Exporting Other File Formats
- •Working with Raster Images
- •Pasting, Linking, and Embedding Objects
- •Summary
- •Sending Drawings
- •Opening Drawings from the Web
- •Creating Object Hyperlinks
- •Publishing Drawings
- •Summary
- •Working with Customizable Files
- •Creating Keyboard Shortcuts for Commands
- •Customizing Toolbars
- •Customizing Tool Palettes
- •Summary
- •Creating Macros with Script Files
- •Creating Slide Shows
- •Creating Slide Libraries
- •Summary
- •Creating Linetypes
- •Creating Hatch Patterns
- •Summary
- •Creating Shapes
- •Creating Fonts
- •Summary
- •Working with Menu Files
- •Customizing a Menu
- •Summary
- •Introducing Visual LISP
- •Getting Help in Visual LISP
- •Working with AutoLISP Expressions
- •Using AutoLISP on the Command Line
- •Creating AutoLISP Files
- •Summary
- •Creating Variables
- •Working with AutoCAD Commands
- •Working with Lists
- •Setting Conditions
- •Managing Drawing Objects
- •Getting Input from the User
- •Putting on the Finishing Touches
- •Summary
- •Understanding Local and Global Variables
- •Working with Visual LISP ActiveX Functions
- •Debugging Code
- •Summary
- •Starting to Work with VBA
- •Writing VBA Code
- •Getting User Input
- •Creating Dialog Boxes
- •Modifying Objects
- •Debugging and Trapping Errors
- •Moving to Advanced Programming
- •A Final Word
- •Installing AutoCAD and AutoCAD LT
- •Configuring AutoCAD
- •Starting AutoCAD Your Way
- •Configuring a Plotter
- •System Requirements
- •Using the CD with Microsoft Windows
- •What’s on the CD
- •Troubleshooting
- •Index
Chapter 36 Exploring Advanced AutoLISP Topics 1039
Debugging Code
Because few people can write perfect code at first try, there’s always a need to debug code. Debugging is simply the process of trying to locate and correct mistakes. In this section, you look at some simple examples, using some of the debugging tools Visual LISP has to offer.
In the first example, you define a function that is guaranteed to fail. You can type this in the Visual LISP editor and load it:
;;;The function below will produce an error
;;;because strcat concatenates strings. (defun Error-Prone-Code ()
(strcat “This is will never print the number: “ 1)
)
Before you continue, you need to choose Debug Break on Error. By selecting this menu option, Visual LISP enables you to jump to the error in your source code automatically.
Using the function error-prone code produces an error because strcat concatenates strings, as the following demonstrates. You can type this at the console:
(Error-Prone-Code)
Visual LISP responds with the following:
;error: bad argument type: stringp 1
After you receive the error, choose Last Break on the Debug toolbar. Visual LISP places you in the line in the code where the error occurred.
How can you find the source of the problem in a routine? To answer this question, you often need to perform some detective work. Visual LISP provides a wealth of debugging tools, which you can leverage when you encounter an unplanned “enhancement” or bug.
STEP-BY-STEP: Finding the Last Break
1.Open a drawing in AutoCAD using the acad.dwt template.
2.Start Visual LISP and start a new file.
3.In the Visual LISP Editor, type the following:
;;;The function add-3-numbers will not produce
;;;an error if all of its arguments are numbers. (defun add-3-numbers (num1 num2 num3)
(+ num1 num2 num3)
)
4.Choose Load Active Edit Window on the Tools toolbar.
5.In the Console window, type the following:
(add-3-numbers 1 2 3)
Visual LISP returns 6.
1040 Part VII Programming AutoCAD
6.However, if you substitute a string for one of its arguments, an error occurs. Type the following in the Console window:
(add-3-numbers 1 “a” 3)
Visual LISP returns the following:
error: bad argument type: numberp: “a”
7.Choose Debug Break on Error. Look again to confirm Break on Error is checked.
8.Choose Last Break on the Debug toolbar. Visual LISP places you in the function add-3- numbers, with (+ num1 num2 num3) as the cause of the error.
To continue after turning on Break on Error, click Reset on the Debug toolbar.
Using the Error Trace window
Any time an error occurs, you can use the last break along with the Visual LISP Error Trace window. To display the Error Trace window, choose View Error Trace to see an error list, as shown in Figure 36-1.
Figure 36-1: To help you debug your code, the Error Trace window displays every function call before the error as well as where the error occurred.
The item numbered <5> in Figure 36-1 is what you entered in the Console. The item labeled [2] (+ 1 “a” 3) is where the error occurred, while <1> :ERROR-BREAK signaled the function’s termination because of the error.
Visual LISP enables you to find the source position (the line of code that produced the error) and the call source point (the position in your code where the function was called) for the error. To find them, right-click the third item in the Error Trace window. From the shortcut menu, you can choose either Source Position or Call Source Point. Jumping to the position in your code where the function was called is extremely handy when debugging a large application.
Working with break points
Sometimes when you choose Last Break to highlight an error, you find that a great deal of code is highlighted, which is not very helpful for finding the error. This is where break points come in handy. Break points are locations in your code, specified by you, that are used to signal Visual LISP to stop and wait until you’re ready to continue processing the code. Visual LISP executes your code and stops at each break point and waits for your instructions. Break points enable you to break down your code into smaller pieces and watch what’s going on piece-by-piece so you can more easily find the error.
Chapter 36 Exploring Advanced AutoLISP Topics 1041
To place a break point, position your cursor to the left of an opening parenthesis or the right of a closing parenthesis and press F9. Visual LISP places a temporary red mark in your code.
After creating your break points, you need to reload your code to tell Visual LISP about your break points. Then try to execute the function again. Notice that the Debug toolbar buttons become available. Visual LISP executes your code up to the first break point.
You can now use the Debug toolbar to help find your error. The first three buttons offer three different ways to move through your code:
Step Into: Use this button to “step in” one expression from the innermost nested expression (from opening to closing parentheses) to the outermost, one at a time.
Step Over: Use this button to ignore the nested expressions; that is, step over the highlighted expression.
Step Out: Use this button to move to the end of the function. You can ignore the entire function being debugged.
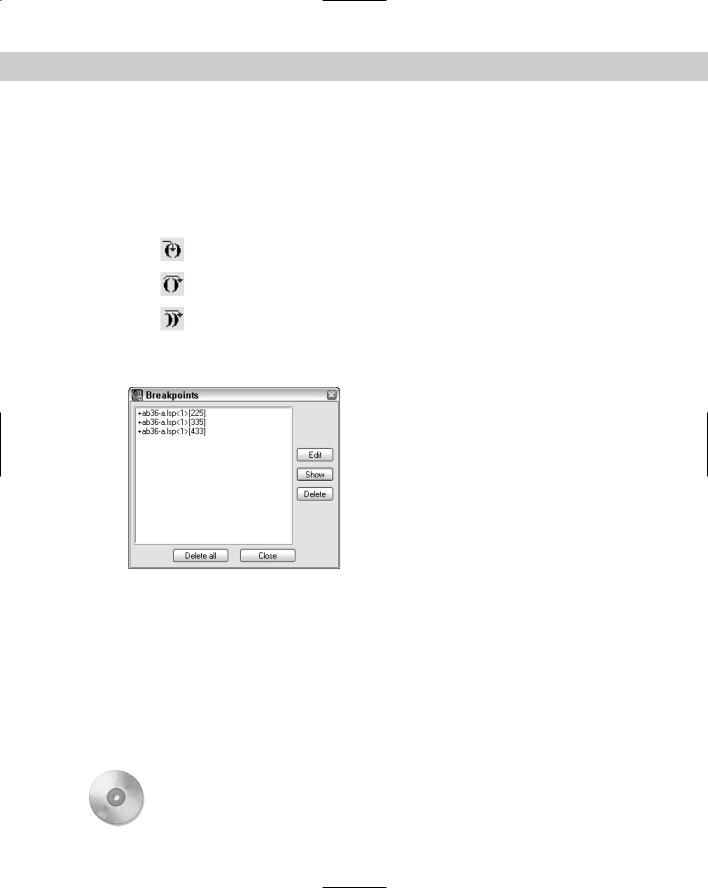
To remove break points, choose View Breakpoints Window to open the Breakpoints dialog box, shown in Figure 36-2.
Figure 36-2: Use the Breakpoints dialog box to remove, show, or disable break points.
In the Breakpoints dialog box, you can do the following:
Delete all break points by clicking Delete All.
Delete individual break points by choosing a break point and clicking Delete.
Jump to a break point by choosing a break point and clicking Show. Visual LISP places a blinking cursor at the break point.
Edit a break point by choosing a break point and clicking Edit. Visual LISP then lets you disable (or delete or show) the break point.
On the |
The file used in the following Step-by-Step exercise on working with break points, |
CD-ROM |
ab36-a.lsp, is in the Drawings folder on the CD-ROM. |

1042 Part VII Programming AutoCAD
STEP-BY-STEP: Working with Break Points
1.Open AutoCAD and start a drawing using any template.
2.Start the Visual LISP Editor. Open ab36-a.lsp from the CD-ROM. Choose File Save As and save it as ab36-01.lsp in the AutoCAD 2005\Support folder or in another folder you’ve added to the support file search path.
3.Choose Load Active Edit Window from the Tools toolbar.
4.Read through the code. This routine creates a vertical list of numbers. The new FOREACH function steps through each item in a list. The comments explain why it contains a bug.
5.If you didn’t do the previous exercise, choose Debug Break on Error. (Don’t do anything if the Break on Error item is already checked.)
6.Type the following in the Console window:
(list-beautify-with-bug ‘(1 2 3 4 5 ))
The Console returns the following:
(1
; error: bad argument type: FILE 1
7.Choose Last Break on the Debug toolbar to jump to the error in the source code.
8.To place a break point in the code, place the cursor after (princ (chr 40)). Press F9. Visual LISP marks the break with a red box.
9.Place another break point after (princ (car aList)). Finally, place a third break point after the closing parenthesis on the line that follows (princ item 1). Your code should look like Figure 36-3.
Figure 36-3: Your code after placing three break points.
Chapter 36 Exploring Advanced AutoLISP Topics 1043
10.After the code produces an error, you need to reset. Click Reset on the Debug toolbar.
11.Click the Visual LISP Editor window and reload the function into Visual LISP. (Choose Load Active Edit Window on the Tools toolbar.)
12.Type the same expression that produced the error in the Console:
(list-beautify-with-bug ‘(1 2 3 4 5 ))
13.Visual LISP highlights the expression (princ (chr 40)). Choose Step Into on the Debug toolbar. Visual LISP highlights (princ (car aList)).
14.Choose Step Into. Now only (car aList)) is highlighted.
15.Choose Step Into until you reach the error, (princ item 1).
16.Edit (princ item 1) so that it reads (princ item).
17.Click Reset again.
18.Choose Debug Clear All Breakpoints. Click Yes to confirm.
19.Activate the Editor window and reload the function.
20.In the Console, type (list-beautify-with-bug '(1 2 3 4 5 )) .
21.Activate the Editor window and save the file.
On the |
If you have difficulty in fixing this bug, you can find the “repaired” version in the Results |
CD-ROM |
folder on the CD-ROM with the filename list-beautify-without-bug.lsp. |
Using the Watch window
The Watch window enables you to examine expressions and variable values as they’re being evaluated. To watch a variable, select it in the code and choose Debug Add Watch
or press Ctrl+W. Visual LISP opens the Watch window listing the expression or variable and displaying its value after an equal sign. If you select an expression or nothing is selected and you press Ctrl+W, the Add Watch dialog box opens. If not already displayed, enter the expression to watch and click OK. For example, if you add a watch for (princ (chr 40)), the Watch window displays (PRINC (CHR 40)) = “(“ because (princ (chr 40)) is another way of telling AutoLISP to print a left parenthesis. After the Watch window is open, you can add expressions or variables by selecting them and choosing Add Watch on the Watch window toolbar.
If you have a routine with arguments, you can execute the function with various arguments and see the results on your watched expressions and variables in the Watch window.
Furthermore, you can add any expression to the Watch window and alter the contents of any variable while debugging a function.
On the |
The file used in the following Step-by-Step exercise on using the Watch window, ab36-01. |
CD-ROM |
lsp, is in the Results folder on the CD-ROM. |
1044 Part VII Programming AutoCAD
STEP-BY-STEP: Using the Watch Window
1.Open AutoCAD and start a drawing using the acad.dwt template.
2.Start the Visual LISP Editor. Open ab36-01.lsp from the Results folder of the CD-ROM. If you did the previous exercise, you can open it from your AutoCAD Bible folder.
3.Select the expression (princ (chr 40)). Choose Debug Add Watch. Click OK in the Add Watch dialog box. Visual LISP opens the Watch window and displays the expression as well as its value.
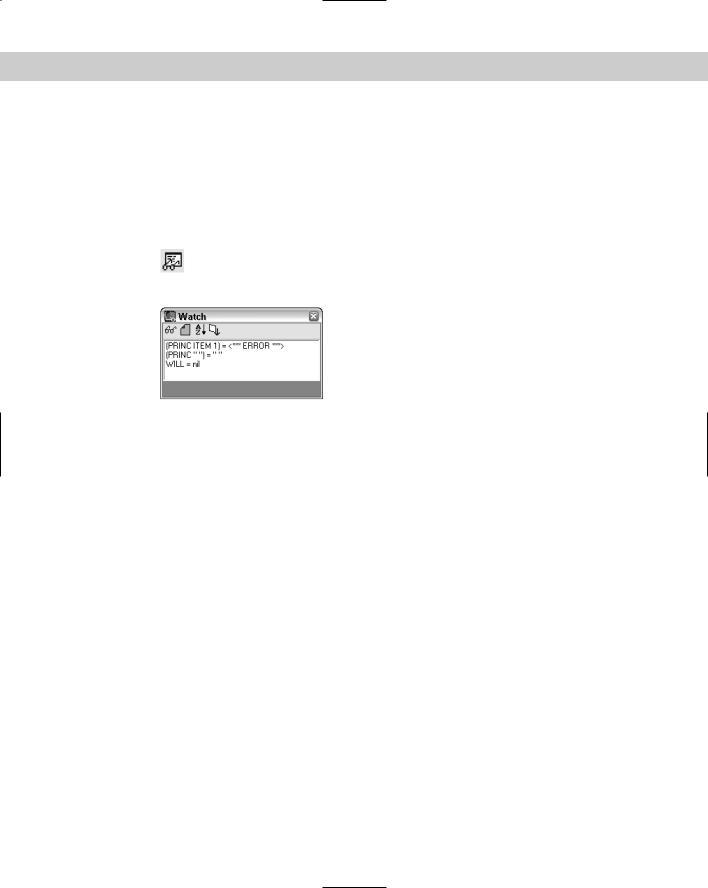
4.To add a variable to the Watch window, select the item to the right of the FOREACH function and choose Add Watch in the Watch window. The Watch window should
look like Figure 36-4.
Figure 36-4: The Watch window shows an expression and a variable and displays their values.
5.Add a break point after (princ item) by placing the cursor there and pressing F9.
6.Choose Load Active Edit Window from the Tools toolbar.
7.To examine the Watch window display as the function list-beautify-with-bug is evaluated, type the following in the Visual LISP Console:
(list-beautify-with-bug ‘(1 2 3 4 5 ))
8.The (princ item) expression should be highlighted. Choose Step Into on the Debug toolbar. The item variable in the Watch window should now display its current value. Continue to click Step Into, watching the value of item increase in the Watch window each time you step through the cycle.
9.In the Visual LISP console, type aList after the last prompt. This is a variable argument used in the function list-beautify-with-bug. The Console returns:
(1 2 3 4 5)
As you can see, you can interrogate any variable while debugging the function.
10.To add a new expression to the Watch window, select the variable aList and press Ctrl+W.
11.To change the value of aList, return to the Console window and type the following:
(setq aList (list 6 7 8 9 10))
The Console responds as follows:
(6 7 8 9 10)
Notice the change in the Watch window.