

- •Foreword
- •Preface
- •Is This Book for You?
- •How This Book Is Organized
- •How to Use This Book
- •Doing the Exercises
- •Conventions Used in This Book
- •What the Icons Mean
- •About the CD-ROM
- •Other Information
- •Contacting the Author
- •Acknowledgments
- •Contents at a Glance
- •Contents
- •Getting Acquainted with AutoCAD and AutoCAD LT
- •Starting AutoCAD and AutoCAD LT
- •Creating a New Drawing
- •Using the AutoCAD and AutoCAD LT Interface
- •Creating Your First Drawing
- •Saving a Drawing
- •Summary
- •Creating a New Drawing from a Template
- •Working with Templates
- •Opening a Drawing with Default Settings
- •Opening an Existing Drawing
- •Using an Existing Drawing as a Prototype
- •Saving a Drawing Under a New Name
- •Summary
- •The Command Line
- •Command Techniques
- •Of Mice and Pucks
- •Getting Help
- •Summary
- •Typing Coordinates
- •Displaying Coordinates
- •Picking Coordinates on the Screen
- •Locating Points
- •Summary
- •Unit Types
- •Drawing Limits
- •Understanding Scales
- •Inserting a Title Block
- •Common Setup Options
- •The MVSETUP Command
- •Summary
- •Using the LINE Command
- •Drawing Rectangles
- •Drawing Polygons
- •Creating Construction Lines
- •Creating Rays
- •Summary
- •Drawing Circles
- •Drawing Arcs
- •Creating Ellipses and Elliptical Arcs
- •Making Donuts
- •Placing Points
- •Summary
- •Panning
- •The ZOOM Command
- •Aerial View
- •Named Views
- •Tiled Viewports
- •Snap Rotation
- •User Coordinate Systems
- •Isometric Drawing
- •Summary
- •Editing a Drawing
- •Selecting Objects
- •Summary
- •Copying and Moving Objects
- •Using Construction Commands
- •Creating a Revision Cloud
- •Hiding Objects with a Wipeout
- •Double-Clicking to Edit Objects
- •Grips
- •Editing with the Properties Palette
- •Selection Filters
- •Groups
- •Summary
- •Working with Layers
- •Changing Object Color, Linetype, and Lineweight
- •Working with Linetype Scales
- •Importing Layers and Linetypes from Other Drawings
- •Matching Properties
- •Summary
- •Drawing-Level Information
- •Object-Level Information
- •Measurement Commands
- •AutoCAD’s Calculator
- •Summary
- •Creating Single-Line Text
- •Understanding Text Styles
- •Creating Multiline Text
- •Creating Tables
- •Inserting Fields
- •Managing Text
- •Finding Text in Your Drawing
- •Checking Your Spelling
- •Summary
- •Working with Dimensions
- •Drawing Linear Dimensions
- •Drawing Aligned Dimensions
- •Creating Baseline and Continued Dimensions
- •Dimensioning Arcs and Circles
- •Dimensioning Angles
- •Creating Ordinate Dimensions
- •Drawing Leaders
- •Using Quick Dimension
- •Editing Dimensions
- •Summary
- •Understanding Dimension Styles
- •Defining a New Dimension Style
- •Changing Dimension Styles
- •Creating Geometric Tolerances
- •Summary
- •Creating and Editing Polylines
- •Drawing and Editing Splines
- •Creating Regions
- •Creating Boundaries
- •Creating Hatches
- •Creating and Editing Multilines
- •Creating Dlines
- •Using the SKETCH Command
- •Digitizing Drawings with the TABLET Command
- •Summary
- •Preparing a Drawing for Plotting or Printing
- •Creating a Layout in Paper Space
- •Working with Plot Styles
- •Plotting a Drawing
- •Summary
- •Combining Objects into Blocks
- •Inserting Blocks and Files into Drawings
- •Managing Blocks
- •Using Windows Features
- •Working with Attributes
- •Summary
- •Understanding External References
- •Editing an Xref within Your Drawing
- •Controlling Xref Display
- •Managing Xrefs
- •Summary
- •Preparing for Database Connectivity
- •Connecting to Your Database
- •Linking Data to Drawing Objects
- •Creating Labels
- •Querying with the Query Editor
- •Working with Query Files
- •Summary
- •Working with 3D Coordinates
- •Using Elevation and Thickness
- •Working with the User Coordinate System
- •Summary
- •Working with the Standard Viewpoints
- •Using DDVPOINT
- •Working with the Tripod and Compass
- •Getting a Quick Plan View
- •Shading Your Drawing
- •Using 3D Orbit
- •Using Tiled Viewports
- •Defining a Perspective View
- •Laying Out 3D Drawings
- •Summary
- •Drawing Surfaces with 3DFACE
- •Drawing Surfaces with PFACE
- •Creating Polygon Meshes with 3DMESH
- •Drawing Standard 3D Shapes
- •Drawing a Revolved Surface
- •Drawing an Extruded Surface
- •Drawing Ruled Surfaces
- •Drawing Edge Surfaces
- •Summary
- •Drawing Standard Shapes
- •Creating Extruded Solids
- •Drawing Revolved Solids
- •Creating Complex Solids
- •Sectioning and Slicing Solids
- •Using Editing Commands in 3D
- •Editing Solids
- •Listing Solid Properties
- •Summary
- •Understanding Rendering
- •Creating Lights
- •Creating Scenes
- •Working with Materials
- •Using Backgrounds
- •Doing the Final Render
- •Summary
- •Accessing Drawing Components with the DesignCenter
- •Accessing Drawing Content with Tool Palettes
- •Setting Standards for Drawings
- •Organizing Your Drawings
- •Working with Sheet Sets
- •Maintaining Security
- •Keeping Track of Referenced Files
- •Handling Errors and Crashes
- •Managing Drawings from Prior Releases
- •Summary
- •Importing and Exporting Other File Formats
- •Working with Raster Images
- •Pasting, Linking, and Embedding Objects
- •Summary
- •Sending Drawings
- •Opening Drawings from the Web
- •Creating Object Hyperlinks
- •Publishing Drawings
- •Summary
- •Working with Customizable Files
- •Creating Keyboard Shortcuts for Commands
- •Customizing Toolbars
- •Customizing Tool Palettes
- •Summary
- •Creating Macros with Script Files
- •Creating Slide Shows
- •Creating Slide Libraries
- •Summary
- •Creating Linetypes
- •Creating Hatch Patterns
- •Summary
- •Creating Shapes
- •Creating Fonts
- •Summary
- •Working with Menu Files
- •Customizing a Menu
- •Summary
- •Introducing Visual LISP
- •Getting Help in Visual LISP
- •Working with AutoLISP Expressions
- •Using AutoLISP on the Command Line
- •Creating AutoLISP Files
- •Summary
- •Creating Variables
- •Working with AutoCAD Commands
- •Working with Lists
- •Setting Conditions
- •Managing Drawing Objects
- •Getting Input from the User
- •Putting on the Finishing Touches
- •Summary
- •Understanding Local and Global Variables
- •Working with Visual LISP ActiveX Functions
- •Debugging Code
- •Summary
- •Starting to Work with VBA
- •Writing VBA Code
- •Getting User Input
- •Creating Dialog Boxes
- •Modifying Objects
- •Debugging and Trapping Errors
- •Moving to Advanced Programming
- •A Final Word
- •Installing AutoCAD and AutoCAD LT
- •Configuring AutoCAD
- •Starting AutoCAD Your Way
- •Configuring a Plotter
- •System Requirements
- •Using the CD with Microsoft Windows
- •What’s on the CD
- •Troubleshooting
- •Index

Chapter 17 Plotting and Printing Your Drawing |
471 |
|
Figure 17-13: The completed drawing layout is |
|
now ready for plotting. |
Note |
The PSLTSCALE system variable controls linetype scaling in paper space viewports. By default, |
|
it is set to 1 so that the paper space scale controls the scale of any noncontinuous linetypes. |
|
This lets you have viewports of differing scales but display linetypes identically. When you set |
|
PSLTSCALE to 0, linetype scales are based on the drawing units where the object was created |
|
(in either model space or paper space). Linetypes are still scaled by the LTSCALE factor. When |
|
you either change PSLTSCALE or change the zoom scale in a viewport with PSLTSCALE set to |
|
1, you need to do a regen to update the linetype scales in each viewport. |
Working with Plot Styles
A plot style is an object property, like color, linetype, lineweight, or layer. Just as you can assign a color to an object and also to a layer, you can assign a plot style to an object and also to a layer. Because a plot style determines how an object is plotted, its function is to override the object’s original properties. A plot style is more complex than a color or a linetype, however, because it contains a set of properties, such as color-related properties, linetype, lineweight, and line styles. The use of plot styles is completely optional. Without plot styles, objects are simply plotted according to their properties.
You can use plot styles to create several types of plots for one drawing or layout. Plot styles also enable you to use some of the newer printer-like capabilities of plotters, such as screening and dithering.
Plot styles are stored in plot-style tables, which are files that you can create and edit. You generally follow these steps to use plot styles in your plots:
1.Create a plot-style table.
2.Attach a plot-style table to a layout or a viewport.
3.Set the plot-style property for a layer or object.
4.Plot.

472 Part II Drawing in Two Dimensions
Setting the plot-style mode
Plot styles come in two types — color-dependent and named. Before you work with plot styles, you need to choose which type you want to use:
Color-dependent plot styles, the default, are saved in color-dependent plot-style tables, which are files with a file extension of .ctb. You assign plotting properties based on object color. The disadvantage of color-dependent plot styles is that you can’t assign different properties to two objects that have the same color.
Named plot styles are saved in named plot-style tables, which are files with a file extension of .stb. Named plot styles let you assign plotting properties to objects regardless of their color. Therefore, two objects of the same color can be plotted differently.
After you decide which type of plot style you want to use, you set the mode by choosing Tools Options and clicking the Plot and Publish tab. Click the Plot Style Table Settings button. In the Plot Style Tables Settings dialog box, choose either Use Color Dependent Plot Styles or Use Named Plot Styles.
In the same location, you can set the default plot-style table (the default is acad.stb or aclt.stb for named and acad.ctb or aclt.ctb for color-dependent plot styles), the default plot style for layer 0 (the default is Normal), and the default plot style for objects (the default is ByLayer). The default plot style for objects is the current plot style for new objects, similar in concept to the current color, linetype, lineweight, or layer for new objects. After you’re done, click OK.
It is very important to understand that changing the plot style mode does not affect the current drawing. To use the new setting you must either open a new drawing or open a drawing from a previous release that has not been saved in AutoCAD 2000/AutoCAD LT 2000 or later format.
Caution |
If you have color-dependent plot styles for existing pre–AutoCAD 2000/AutoCAD LT 2000 |
|
drawings (and want to keep them that way) but decide to use named plot styles for new draw- |
|
ings, you need to avoid opening any of the existing drawings while you’re in named plot style |
|
mode; if you do, they’ll be changed to named plot style mode. Remember that pre–Release |
|
2000 drawings don’t have any plot styles and that plot settings had to be according to color. |
|
You might consider setting the mode to color-dependent plot styles, creating a script file to |
|
open and save all your existing drawings as AutoCAD 2005 or AutoCAD LT 2005 drawings, |
|
and only then change the mode to named plot styles. Chapter 30 explains how to create |
|
script files. |
If necessary, you can convert color-dependent plot style tables for a drawing to named plot style tables using the CONVERTCTB command. You can then use the CONVERTPSTYLES command to convert the drawing so that it uses named plot styles. You can also use the CONVERTPSTYLES command to convert a drawing from using named plot styles to colordependent plot styles.
Creating a plot-style table
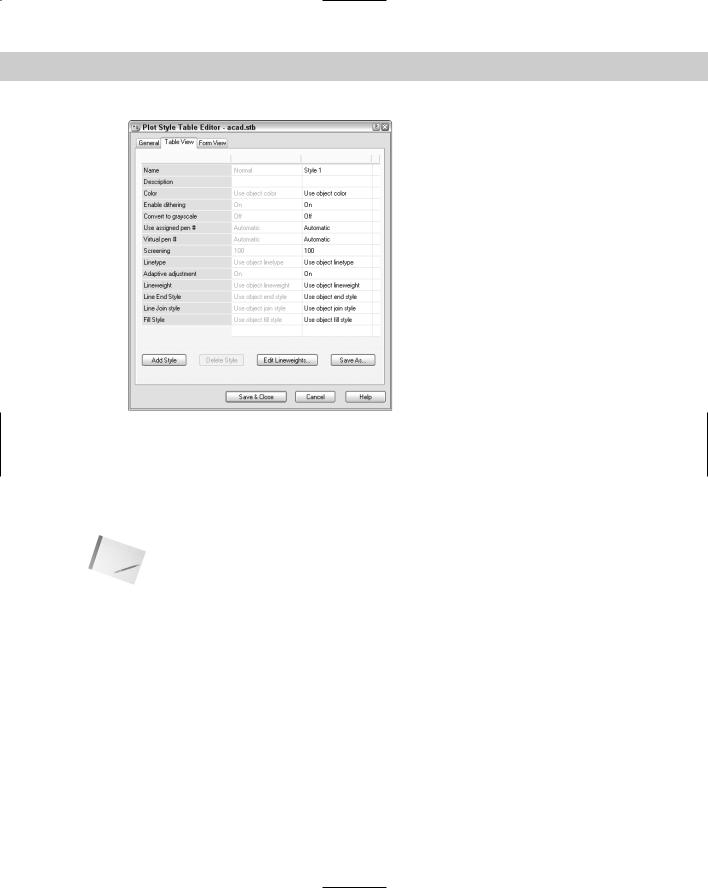
Each named plot-style table comes with a default plot style called Normal. By default, the plot style for each layer is Normal. Figure 17-14 shows the Normal plot style, shown in a plot-style table with a Style1 that you can use to create a new plot style. The Normal plot style is grayed out because you cannot change it.
Chapter 17 Plotting and Printing Your Drawing |
473 |
Figure 17-14: The Normal plot style is the default plot style for layers.
The plot-style Table View tab lists your plot styles side-by-side. Each plot style includes settings for the various definition categories available in a plot style.
Plot style tables are stored in the Plot Styles folder. The default plot-style tables are acad.stb or aclt.stb (named plot style) and acad.ctb or aclt.ctb (color-dependent plot style).
Note |
To find the location of the Plot Styles folder, choose Tools Options and click the Files tab. |
|
Double-click Printer Support File Path and then double-click Plot Style Table Search Path. |
You can use plot configuration files (PCP and PC2 files) or the Release 14 configuration file (acadr14.cfg) to create plot-style tables in order to import your previously created configuration information. You can also create plot-style tables from scratch.
Creating a named plot-style table
To use plot styles, you can add a plot style to an existing plot-style table or create a new plotstyle table. Each plot-style table is a separate file. To create a named plot-style table, use the Add Plot Style Table Wizard. You can access this wizard in two ways:
Choose File Plot Style Manager to open the \Plot Styles folder. Then double-click the Add Plot Style Table Wizard icon. From this folder you can also access existing plotstyle tables for editing.
Choose Tools Wizards Add Plot Style Table.
474 Part II Drawing in Two Dimensions
The wizard opens with an explanation of plot-style tables. Follow these steps:
1.Choose Next.
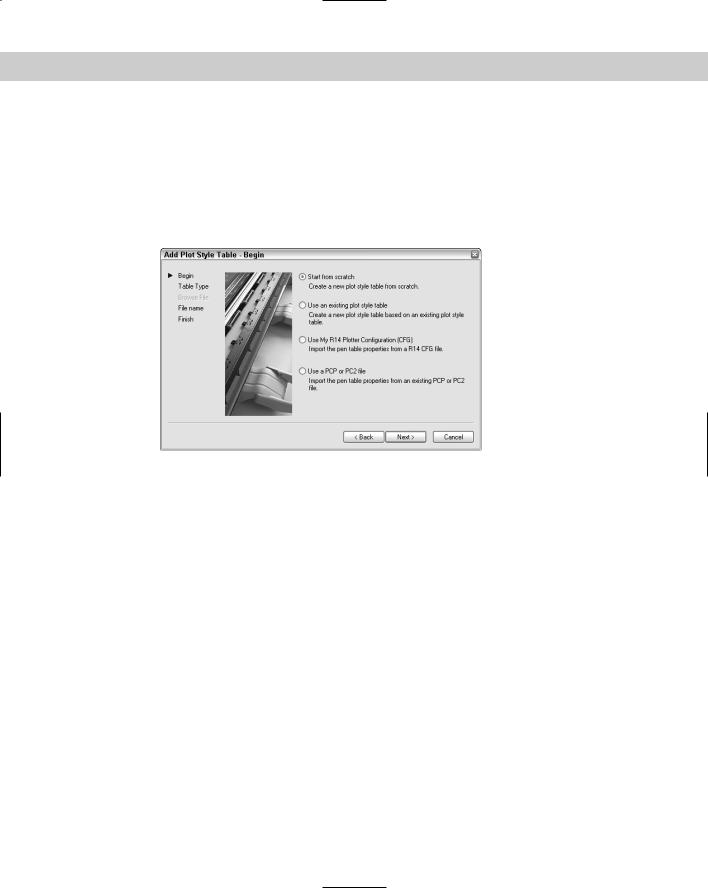
2.On the Begin screen, shown in Figure 17-15, choose the source you want to use for the plot-style table. You can start from scratch or use an existing plot-style table. Choose Use My R14 Plotter Configuration (CFG) to use the pen assignments from the acadr14. cfg file. If you have a PCP (Release 12/13) or PC2 (Release 14) configuration file, you can use it to import the settings from that file into the plot-style table. Then click Next.
Figure 17-15: In the Begin screen of the Add Plot Style Table Wizard, choose the source you want to use for the new plotstyle table.
3.If you choose to start from scratch or to use R14 Plotter Configuration or PCP/PC2 files, choose whether you want color-dependent or named plot styles. If you chose to use an existing file as a basis for the plot-style table, choose the file. If you chose to use a CFG file, also specify the plotter, because the CFG file can contain information for more than one plotter. Click Next.
4.On the File Name screen, type a name for the plot-style table file. Click Next.
5.On the Finish screen, if the Use this plot style table for new and pre-AutoCAD 2004 drawings option is available, check this option to attach the plot-style table to all new drawings by default. You don’t have to use the plot styles, but they will be available. Clear the option if you don’t want to attach this plot-style table to new drawings by default. You can also click Plot Style Table Editor to edit plot styles immediately. You can edit plot styles at any time, as explained next. Click Finish.
Editing a plot-style table
After you create a plot-style table, you can edit it by adding, naming, and deleting its plot styles (for named plot-style tables only) and, of course, creating the settings you want for the plot styles. To open the Plot Style Table Editor, do one of the following:

Chapter 17 Plotting and Printing Your Drawing |
475 |
Choose Plot Style Table Editor from the Finish screen of the Add Plot Style Table Wizard.
Choose File Plot Style Manager and double-click any existing CTB or STB file.
From the Page Setup dialog box (discussed earlier in this chapter) or the Plot dialog box (discussed later in this chapter), choose the named plot-style table you want to edit from the Plot Style Table drop-down list and click Edit.
From the Select Plot Style dialog box (accessed from the Layer Properties Manager after you click the Plot Style column), choose Editor.
Choose Tools Options and click the Plotting tab. Choose Add or Edit Plot Style Tables.
The Plot Style Table Editor’s Table View tab was shown in Figure 17-14. The Form View tab is shown in Figure 17-16. You can edit styles using either view tab. The Form View tab focuses on one style at a time and provides better visual confirmation of some of the choices. The Table View tab lets you compare your style to existing styles as you work.
A new Plot Style Table includes one default style, Normal.To add a style, click Add Style. Before you go any further, click the style name and type a more descriptive name for the style.
Caution |
You can’t rename a plot style that is currently assigned to an object or layer, so it’s best to |
|
name it when you create it. You can’t change the names of styles in a color-dependent plot- |
|
style table. |
Figure 17-16: The Form View tab of the Plot Style Table Editor.

476 Part II Drawing in Two Dimensions
Each plot style has a description area that you can use to provide a more detailed description of the plot style. For example, you could summarize a plot style as “color black & no lineweight.”
Now go down each of the properties and make any changes you want. In Table view, you need to click the property in the Plot Styles column for a drop-down list to appear. The properties are as follows:
Color: You can specify a color other than the default, which is Object Color. For example, you might want to create a plot style that plots everything in black or red. For more options, choose Select Color and define a color in the Select Color dialog box. (See Chapter 11 for an explanation of how to use the Select Color dialog box.)
Dither: Dithering is a method of using dot patterns to approximate a greater range of colors. Not all plotters support dithering. Dithering gives the impression of more colors but can make thin lines and dim colors look unclear.
Grayscale: Converts objects to grayscale, if supported by the plotter. You could use grayscale to deemphasize certain layers.
Pen # and Virtual Pen #: These settings apply to pen plotters only (the Virtual Pen # setting applies to non-pen plotters that can simulate pen plotters) and specify which pen to use for the object assigned the plot style.
Screening: Specifies the amount of ink used for a color. The range is from 0 (no ink; that is, white) to 100 (full intensity of the color). Some plotters — for example, pen plotters — do not support screening. You could use a 50-percent screen to deemphasize certain layers, such as those containing proposed changes.
Linetype: You can specify a linetype other than the default, Object Linetype, to override the object’s linetype when you plot. You might want to have the option to plot certain objects that are not yet approved in a dashed or dotted linetype, for example.
Adaptive: Choose On to adapt the scale of a linetype to complete the linetype pattern on the object. Choose Off if maintaining the proper linetype scale is essential.
Lineweight: You can specify a lineweight other than the default, Object Lineweight. For example, if you’re using heavy lineweights, you might want to specify a narrower lineweight to save ink on a draft plot.
Line End Style: When you use lineweights, you need to specify how you want to end lines. You can choose from Butt, Square, Round, and Diamond. The default is Object End Style.
Line Join: Specifies how objects with lineweights are joined. The choices are Miter, Bevel, Round, and Diamond. The default is Object Join Style.
Line Fill Style: You can choose from Solid, Checkerboard, Crosshatch, Diamonds, Horizontal Bars, Slant Left, Slant Right, Square Dots, and Vertical Bar. The default is Object Fill Style.
To delete a style, select it and click Delete. In Table view, click a style’s gray column head to select it.
After you’re done, click the Save & Close button.

Chapter 17 Plotting and Printing Your Drawing |
477 |
Attaching a plot-style table to a layout
As soon as you have your plot-style table and the plot styles you want, you can start using the plot styles. The first step is to attach the table to a layout (including the Model tab).
To attach a plot-style table to a layout or the Model tab, follow these steps:
1.Choose the Layout or Model tab.
2.Right-click the tab and choose Page Setup Manager.
3.Choose a page setup and click Modify.
4.In the Plot Style Table section of the Page Setup dialog box, choose a plot-style table from the Plot Style Table drop-down list.
5.If you’re on the Model tab, choose Yes or No to the question asking whether you want to apply the plot-style table to the Model tab only or to all layouts. If you’re on a layout tab, check the Display Plot Styles check box to see the result of the plot styles in your drawing.
6.Click OK. Then click Close to return to your drawing.
You can view the effects of plot styles in two ways:
To display plot styles in your drawing all the time, display the layout for which you want to view the plot style. Right-click the layout’s tab and choose Page Setup. On the Plot Device tab of the Page Setup dialog box, check Display Plot Styles in the Plot Style Table section. Click OK. (You may have to use REGENALL to see the result.)
You can also see the effects of plot styles in a preview of your plot. Choose Plot from the Standard toolbar and click Preview.
Setting the plot-style property for a layer or object
To use a plot style, you need to assign it to a layer or an object. The plot style is only applied if the plot style is first defined in the plot-style table that you’ve assigned to a layout (or Model tab).
To set the plot style for a layer, follow these steps:
1.Make sure the layout tab you want to use is active.
2.Choose Layer Properties Manager from the Layers toolbar to open the Layer Properties Manager.
3.Choose the layer whose plot style you want to change and click the Plot Style column to open the Select Plot Style dialog box.
4.Choose the plot-style table from the Active Plot Style table list at the bottom of the dialog box.
5.Choose a plot style from the Plot Styles list.
6.Click OK twice to return to your drawing.

478 Part II Drawing in Two Dimensions
Creating a color-dependent plot-style table
Prior to AutoCAD and AutoCAD LT 2000, plotting was integrally related to object color. You assigned pens in a pen plotter according to color, for example. If you want to continue to create settings based on color, you can create a color-dependent plot-style table. To do this, follow the same steps for creating a named plot-style table. On the Pick Plot Style Table screen, choose Color-Dependent Plot Style Table and click Next. The rest of the steps are the same.
The result is a CTB file with 255 styles, one for each color. You cannot add, delete, or rename these styles, but you can edit their properties. For example, you can specify that objects on color 1 should be plotted with no lineweight or a specific linetype. Be aware, however, that color-depen- dent plot styles result in slower display regeneration.
In this chapter, I focus on named plot styles. Creating color-dependent plot styles is very similar.
If you checked Display Plot Styles in the Page Setup dialog box, as explained in the previous section, you should see the result of the plot style. If not, type regenall .
To set the plot style for an object, select the object and choose Properties from the Standard toolbar. Choose the Plot Style item in the Properties palette and choose a plot style from the drop-down list. You can attach a plot style to a viewport (which is an object).
On the |
The drawing used in the following Step-by-Step exercise on creating and applying a plot style, |
CD-ROM |
ab17-b.dwg, is in the Drawings folder on the CD-ROM. |
STEP-BY-STEP: Creating and Applying a Plot Style
1.With any drawing open, choose Tools Options and click the Plotting tab. Take note of the current setting under Default Plot Style Behavior for New Drawings. Remember this setting so that you can set it back to its original setting at the end of the exercise.
2.Click Use Named Plot Styles (unless that is the current setting) and click OK.
3.Open ab17-b.dwg from your CD-ROM, which is a Release 14 drawing.
4.Save the file as ab17-03.dwg in your AutoCAD Bible folder.
5.Choose Tools Wizards Add Plot Style Table. Click Next.
6.In the Begin screen, choose Start from Scratch and click Next. In the next screen, choose Named Plot Style Table (it’s probably already selected) and click Next. In the File Name screen, type ab17-3 and click Next.
7.In the Finish screen, click Finish. (Don’t check Use for New and Pre–AutoCAD 2004 Drawings because this is just an exercise.)
8.Choose File Plot Style Manager. (You could have opened the new plot-style table from the wizard, but this is how you usually do it when you haven’t just finished creating a table.) Double-click ab17-3.stb.